Visualizing the Growth in Working Age Populations Over 10 Years

Link: https://www.visualcapitalist.com/growth-in-working-age-populations-over-10-years/

Graphic:
Excerpt:

Today, the working age population in almost half of U.S. metropolitan areas has declined due to demographic shifts, and this trend is set to continue.

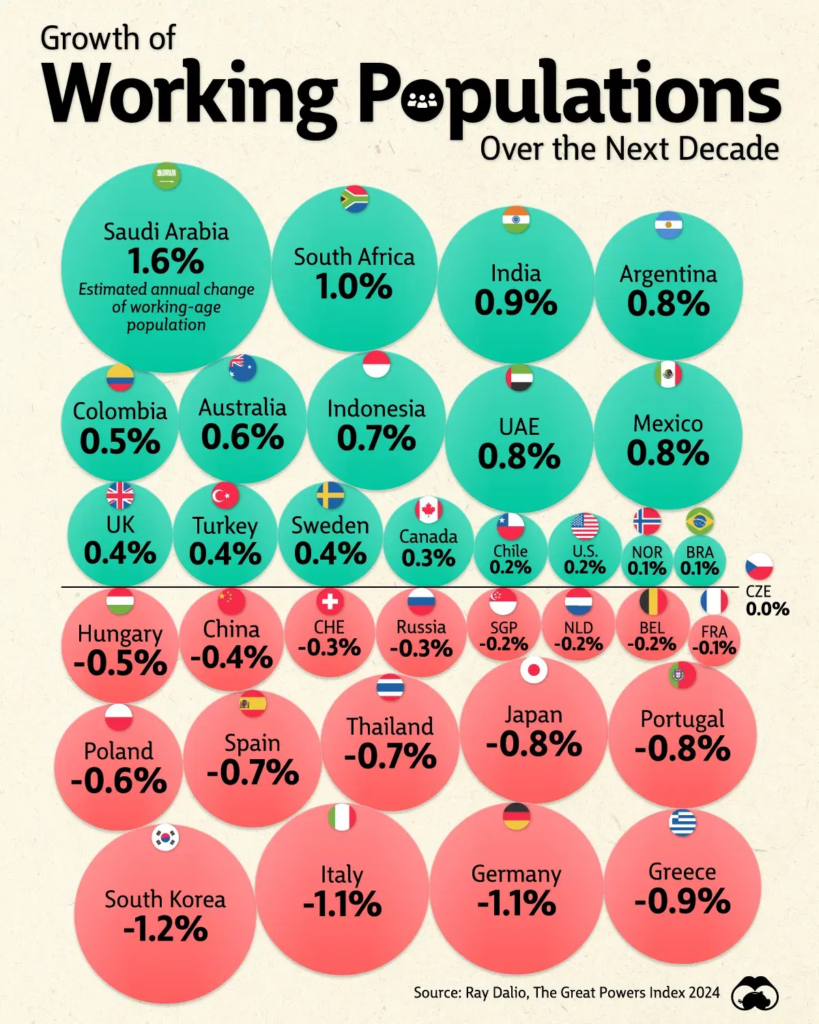
As a result, the U.S. workforce is projected to grow at just 0.2% annually over the next decade, roughly a quarter of the rate of markets like India and Mexico. Given the low birth rates and aging populations across many advanced economies, the world’s workforce is set to change significantly, with implications for economic and productivity growth.

This graphic shows the projected growth in major economies’ working age population, based on analysis from Ray Dalio’s Great Powers Index 2024.

Author(s): Dorothy Neufeld

Publication Date: 23 Sept 2024

Publication Site: Visual Capitalist

12 States Where Working-Age Death Counts Are Still High

Link: https://www.thinkadvisor.com/2023/03/28/12-states-where-working-age-death-counts-are-still-high/

Graphic:

Excerpt:

Death finally seemed to ease up on U.S. residents ages 25 through 64 in February.

The total number of deaths of working-age people in that age group, from all causes, was 5.5% lower than the February average for the period from 2015 through 2019, according to the very earliest mortality data available from the U.S. Centers for Disease Control and Prevention.

But all-cause death counts for working-age people were more than 4.5% higher than the 2015-2019 baseline in 12 states and New York City, and up by almost 40% in one state.

Before the start of the COVID-19 pandemic, anything that increased the death rate for a large group of people by more than 2% was considered a major news story.

….

Limitations

One concern is whether the apparent drop in working-age mortality is due partly to state data submission delays.

At press time, for example, Louisiana had sent the CDC only four days of mortality data for February. Other states might also be slower to send the CDC their numbers.

Author(s): Allison Bell

Publication Date: 28 March 2023

Publication Site: Think Advisor

5 Worst States for Working-Age Deaths in August

Link: https://www.thinkadvisor.com/2022/09/27/5-worst-states-for-working-age-deaths-in-august/

Graphic:

Excerpt:

The number of deaths of working-age Americans was lower in August than in August 2021, but it was still much higher than it was in August 2019, before the COVID-19 pandemic began.

Death figures for the period from July 31 through Aug. 27 are just starting to firm up. But very early figures show that at least 53,655 U.S. residents ages 25 through 64 died from COVID-19 and all other causes during that four-week period.

The number of deaths was down sharply from 77,847 in August 2021, but it was still up 6.1% from the total of 50,590 for August 2019.

Author(s): Allison Bell

Publication Date: 27 Sept 2022

Publication Site: Think Advisor

15 States Where Older Adults Are Going Back to Work

Link: https://www.thinkadvisor.com/2022/06/09/15-states-where-older-adults-are-going-back-to-work/

Excerpt:

Two years after the pandemic hobbled the U.S. economy, pushing up unemployment, Americans are returning to work, including many adults 65 and older, according to new research from MagnifyMoney.

In late April and early May this year, 21.9% of Americans 65 and older were working, up from 19.5% during the same period in 2020. At the same time, the share of U.S. adults who reported that they were retired rose to 17.4% in April and May 2022 from 14.9% two years earlier.

MagnifyMoney found that 25.6% of working older Americans are self-employed, more than triple the rate among working Americans 25 to 39.

The number of working older Americans varies dramatically across the country. In North Dakota, for example, the rate dropped by 11 percentage points over the two-year period, and in Wisconsin by 8.3 points. In contrast, several states saw double-digit increases in employed Americans 65 and older during that period.

Author(s): Michael S. Fischer

Publication Date: 9 Jun 2022

Publication Site: Think Advisor

Illinois data: Deaths of people 18 to 49 soar in 2020-21; most of excess not COVID-related

Link: https://www.thecentersquare.com/illinois/illinois-data-deaths-of-people-18-to-49-soar-in-2020-21-most-of-excess/article_091b8228-807c-11ec-b235-239935b60883.html#new_tab

Graphic:

Excerpt:

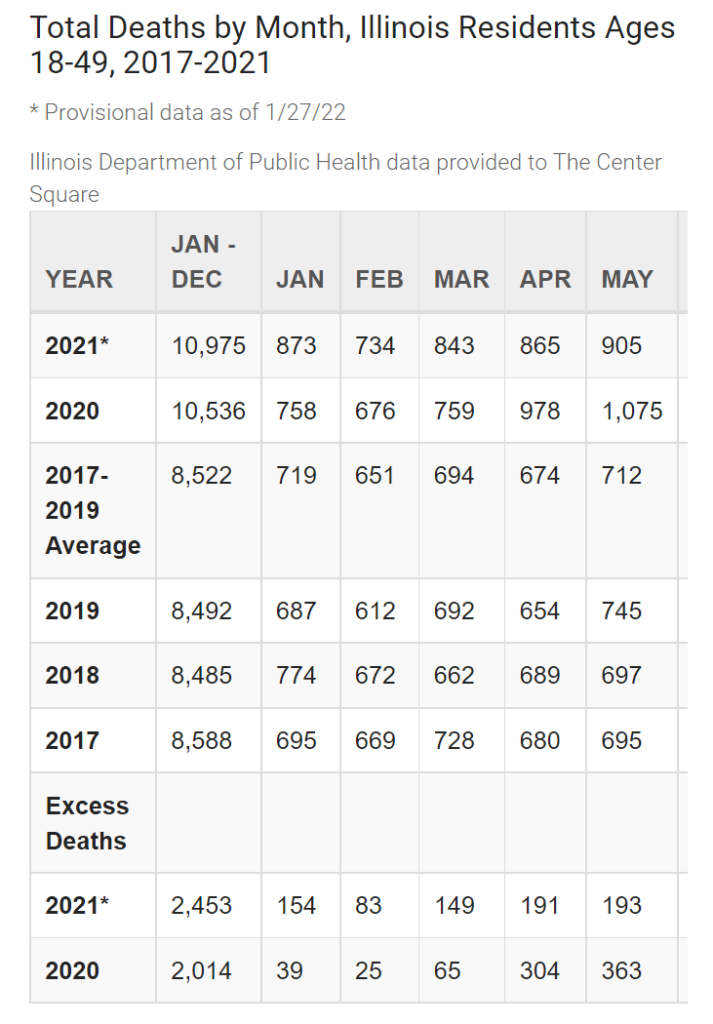
Nearly 27% more people ages 18 to 49 in Illinois have died in each of the past two years than in each of the three years prior. COVID-related deaths in that age group account for just a minority of the excess deaths.

Data the Illinois Department of Public Health provided The Center Square show 29% more fatalities in 2021 and 24% more in 2020 when compared to the average for the three years prior for those ages 18 to 49. Combined for 2020 and 2021, the total number of deaths among that demographic is 21,511.

…..

COVID-related deaths in the past two years totals about 1,700 for that age group. Subtracting the 1,700 COVID deaths from the excess death total of 4,467 leaves 2,767 excess deaths for 2020 and 2021 that are not categorized by IDPH, meaning the causes of death for the excess 2,767 are not described.

…..

While COVID-19 is listed as the third leading cause of death in Illinois for all ages in 2020, the leading cause of deaths IDPH lists for those 18 to 44 is accidents, assaults, suicides and heart disease. COVID-19 is not listed as a leading cause of death at all for ages 18 to 24. COVID-19 does show up at No. 6 for those 25 to 44, or 370 out of a total of 6,439.

Author(s): Greg Bishop

Publication Date: 28 Jan 2022

Publication Site: The Center Square

Nationwide Surge In Deaths Among People Aged 18-49: A State by State Overview

Link: https://www.theepochtimes.com/mkt_morningbrief/northeast-fares-best-amid-2021-prime-age-mortality-spike_4208797.html

Graphic:

Excerpt:

Deaths among people aged 18 to 49 increased more than 40 percent in the 12 months ending October 2021 compared to the same period in 2018–2019, before the COVID-19 pandemic, according to an analysis of death certificate data from the Centers for Disease Control and Prevention (CDC) by The Epoch Times.

The agency doesn’t yet have full 2021 numbers, as death certificate data trickles in with a lag of one to eight weeks or more.

…..

It’s not clear why the mortality spike seemed to exhibit a geographical trend. Overall, a part of the surge could be likely blamed on drug overdoses, which increased to more than 101,000 in the 12 months ending June 2021 from about 72,000 in 2019, the CDC estimated. About two-thirds of those deaths involved synthetic opioids including fentanyl that are often smuggled to the United States from China through Mexico.

For those ages 50 to 84, mortality went up more than 27 percent, representing more than 470,000 excess deaths. Almost four out of five of the deaths had COVID marked on the death certificate as the cause or a contributing factor.

Author(s): Petr Savb

Publication Date: 13 Jan 2022

Publication Site: The Epoch Times

COVID-19 Hospitalizations Are Soaring for Working-Age People, Too

Link: https://www.thinkadvisor.com/2022/01/12/working-age-covid-19-hospitalizations-soar-34-over-september-levels/

Graphic:

Excerpt:

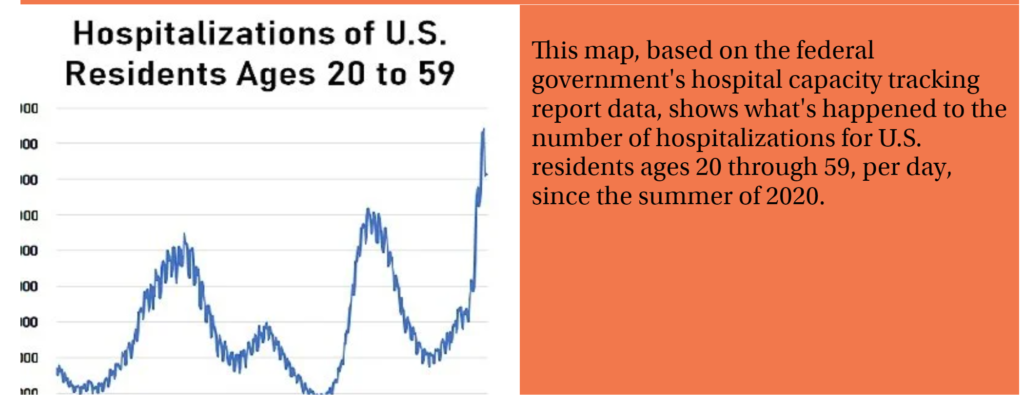
The hospitalization rate for U.S. residents of all ages is about 60% higher than it was during the last hospitalization surge, which lasted from Aug. 10 through Sept. 10.

U.S. COVID-19 patients ages 20 through 59 are doing better than older patients, but they are facing their own, smaller hospitalization surge.

The pandemic put 51,947 people in the 20-59 age group in U.S. hospitals in the week ending Jan. 7.

Author(s): Allison Bell

Publication Date: 12 Jan 2022

Publication Site: Think Advisor

5 States Where Dying People Are Most Likely to Be Working Age

Link: https://www.thinkadvisor.com/2021/12/21/5-states-where-dying-people-are-the-most-likely-to-be-working-age/

Graphic:

Excerpt:

Whatever the omicron variant of COVID-19 does to U.S. life insurance insurance claims, the delta variant and its siblings have been continuing to drive up the number of deaths of working-age Americans.

Some life and health insurers reported that an enormous surge of COVID-19 deaths appeared in September and then seemed to end quickly.

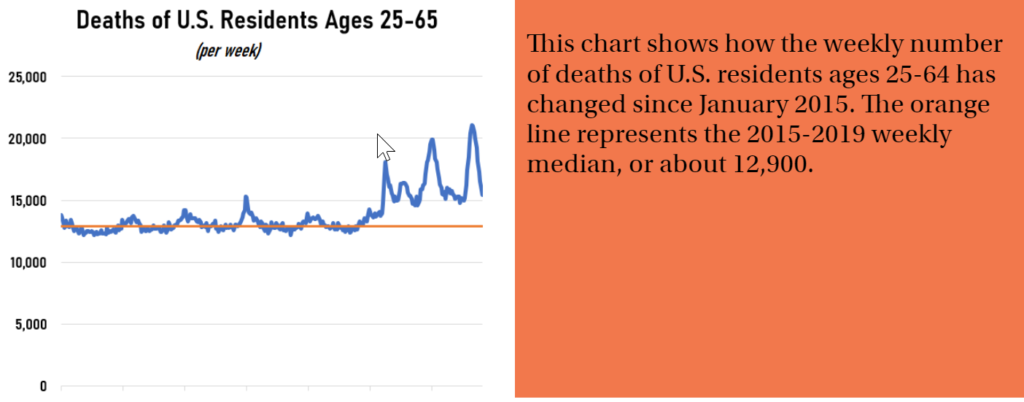
A look at weekly death count data from the U.S. Centers for Disease Control and Prevention shows that, from 2015 through 2019, about 12,900 people ages 25 through 64 died, from all causes, in a typical week.

In September, the number climbed more than 7,000, or more than 50%, over the median.

That total includes both people killed directly by COVID-19 and by the effects of the pandemic on the health care system, the economy and U.S. society as a whole.

Author(s): Allison Bell

Publication Date: 3 Jan 2022

Publication Site: Think Advisor