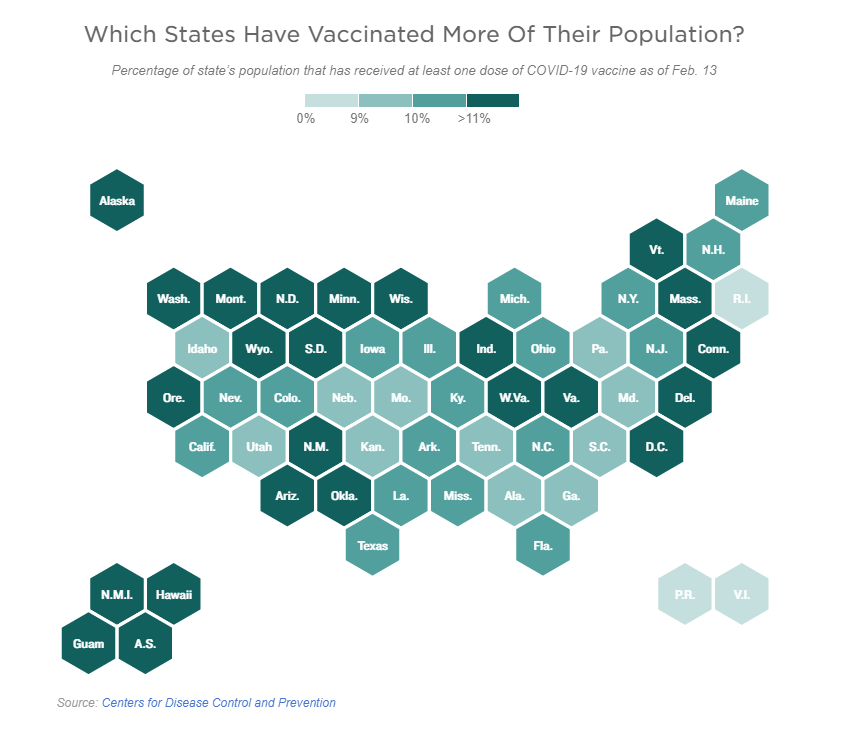
Since vaccine distribution began in the U.S. on Dec. 14, more than 50 million doses have been administered, reaching 11.2% of the total U.S. population, according to federal data collected by the Centers for Disease Control and Prevention. The U.S. is currently administering over 1.6 million shots a day.
Absent that nightmare scenario—and most prognosticators believe science can vanquish any of COVID-19’s shape-shifting—the conventional Wall Street wisdom is for better days ahead on both the health and the economics fronts. And since escalating rates are co-dependent on an improving economy, a sunny thesis appears pretty solid.
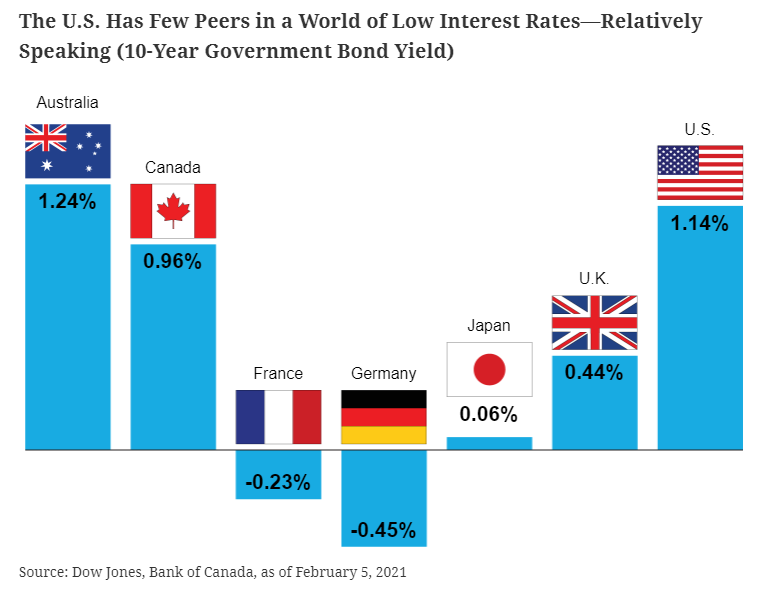
Historically speaking, low rates like today’s are an aberration. Thus, at some point, it’s reasonable to assume they will return to normal. Or at least to higher than now, to a degree. A new normal that’s hardly towering.
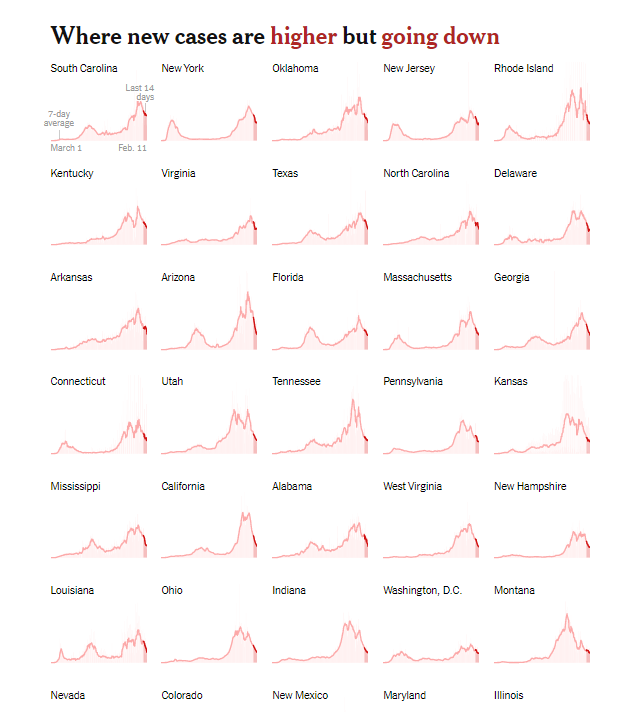
At least 3,878 new coronavirus deaths and 105,515 new cases were reported in the United States on Feb. 11. Over the past week, there has been an average of 101,655 cases per day, a decrease of 36 percent from the average two weeks earlier. As of Friday morning, more than 27,433,900 people in the United States have been infected with the coronavirus according to a New York Times database.
Author(s): Jordan Allen, Sarah Almukhtar, Aliza Aufrichtig, Anne Barnard, Matthew Bloch, Sarah Cahalan, Weiyi Cai, Julia Calderone, Keith Collins, Matthew Conlen, Lindsey Cook, Gabriel Gianordoli, Amy Harmon, Rich Harris, Adeel Hassan, Jon Huang, Danya Issawi, Danielle Ivory, K.K. Rebecca Lai, Alex Lemonides, Eleanor Lutz, Allison McCann, Richard A. Oppel Jr., Jugal K. Patel, Alison Saldanha, Kirk Semple, Julie Walton Shaver, Anjali Singhvi, Charlie Smart, Mitch Smith, Albert Sun, Derek Watkins, Timothy Williams, Jin Wu and Karen Yourish. · Reporting was contributed by Jeff Arnold, Ian Austen, Mike Baker, Brillian Bao, Ellen Barry, Samone Blair, Nicholas Bogel-Burroughs, Aurelien Breeden, Elisha Brown, Emma Bubola, Maddie Burakoff, Alyssa Burr, Christopher Calabrese, Zak Cassel, Robert Chiarito, Izzy Colón, Matt Craig, Yves De Jesus, Brendon Derr, Brandon Dupré, Melissa Eddy, John Eligon, Timmy Facciola, Bianca Fortis, Matt Furber, Robert Gebeloff, Thomas Gibbons-Neff, Matthew Goldstein, Grace Gorenflo, Rebecca Griesbach, Benjamin Guggenheim, Barbara Harvey, Lauryn Higgins, Josh Holder, Jake Holland, Jon Huang, Anna Joyce, John Keefe, Ann Hinga Klein, Jacob LaGesse, Alex Lim, Alex Matthews, Patricia Mazzei, Jesse McKinley, Miles McKinley, K.B. Mensah, Sarah Mervosh, Jacob Meschke, Lauren Messman, Andrea Michelson, Jaylynn Moffat-Mowatt, Steven Moity, Paul Moon, Derek M. Norman, Anahad O’Connor, Ashlyn O’Hara, Azi Paybarah, Elian Peltier, Sean Plambeck, Laney Pope, Elisabetta Povoledo, Cierra S. Queen, Savannah Redl, Scott Reinhard, Thomas Rivas, Frances Robles, Natasha Rodriguez, Jess Ruderman, Kai Schultz, Alex Schwartz, Emily Schwing, Libby Seline, Sarena Snider, Brandon Thorp, Alex Traub, Maura Turcotte, Tracey Tully, Lisa Waananen Jones, Amy Schoenfeld Walker, Jeremy White, Kristine White, Bonnie G. Wong, Tiffany Wong, Sameer Yasir and John Yoon. · Data acquisition and additional work contributed by Will Houp, Andrew Chavez, Michael Strickland, Tiff Fehr, Miles Watkins, Josh Williams, Shelly Seroussi, Rumsey Taylor, Nina Pavlich, Carmen Cincotti, Ben Smithgall, Andrew Fischer, Rachel Shorey, Blacki Migliozzi, Alastair Coote, Jaymin Patel, John-Michael Murphy, Isaac White, Steven Speicher, Hugh Mandeville, Robin Berjon, Thu Trinh, Carolyn Price, James G. Robinson, Phil Wells, Yanxing Yang, Michael Beswetherick, Michael Robles, Nikhil Baradwaj, Ariana Giorgi, Bella Virgilio, Dylan Momplaisir, Avery Dews, Bea Malsky and Ilana Marcus
[MPC here: I am not tagging all these people. Sorry, y’all]
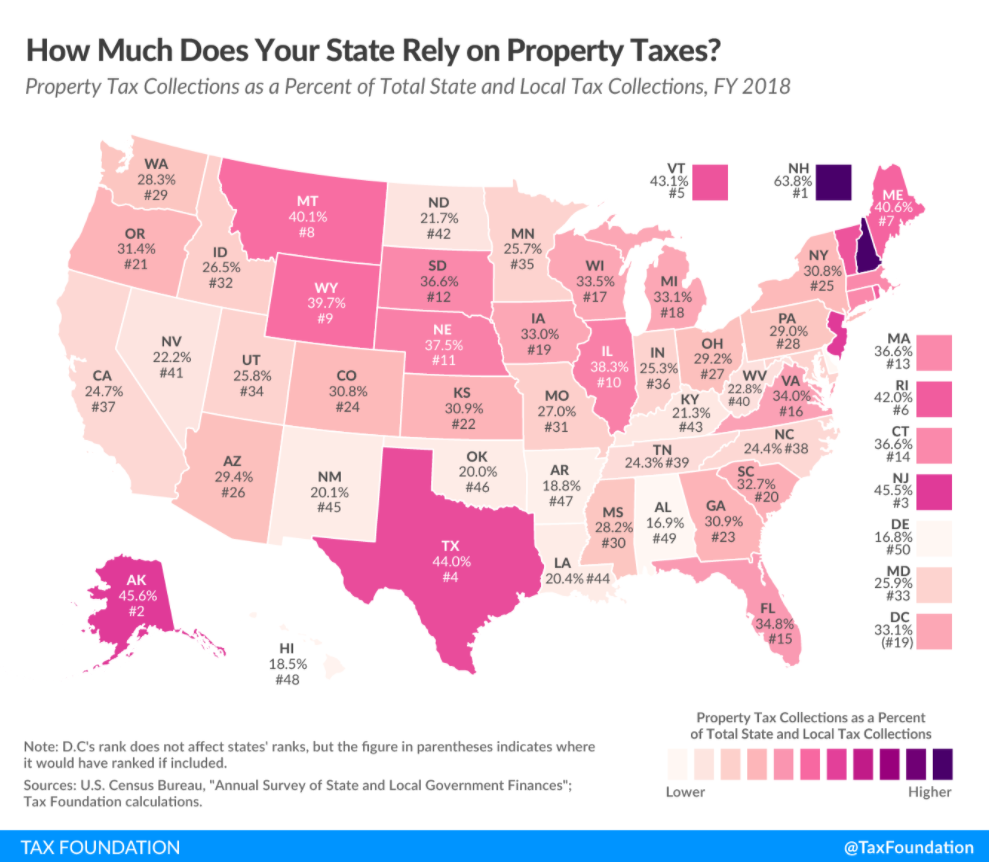
Property taxes represent a major source of revenue for states and the largest source of tax revenue for localities. In fiscal year 2018, the most recent data available, property taxes were such a significant source of local revenue that they accounted for 71.7 percent of local tax collections nationwide and 31.1 percent of total U.S. state and local tax collections, a greater proportion than any other source of tax revenue. In that same year, 25 states and the District of Columbia collected the greatest share of their combined state and local tax revenue from property taxes, with property taxes the largest share of local revenue in all but two states (Arkansas and Louisiana, both of which have high local sales taxes).
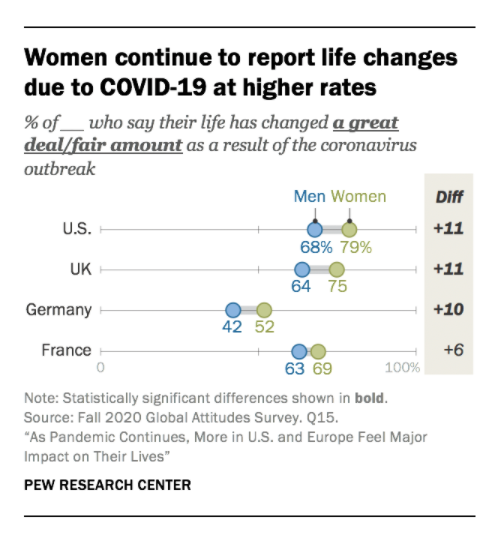
At the same time, as coronavirus case counts soar in each of these four nations, publics are largely split on whether their country has done a good job handling the outbreak. Ideology plays a role in people’s assessments of their national coronavirus response, but this rings especially true in the U.S. and UK, where those on the political left are more critical. Those who feel better about their nation’s economic situation are more likely to give positive reviews of how the virus has been handled thus far.
One reason regulators might be stymied is a lack of political will to limit trading by small investors. When Robinhood temporarily blocked its customers from trading GameStop shares during the frenzy, a cry went up about market access. The big losses those little guys inflicted on some hedge funds by bidding up the stock was seen as a democratization of the market. Any effort to derail that could be criticized as protection for Wall Street.
“Most people believe that middle-class people, working people, should be able to take their chances on the stock market,” Rep. Maxine Waters (D., Calif.), who leads the House Financial Services Committee, said in an interview.
The consensus among regulators so far is that the episode didn’t expose major problems with the market’s plumbing. The Treasury Department said Thursday that regulators believe the market’s “core infrastructure was resilient.” The department said the SEC is reviewing “whether trading practices are consistent with investor protection and fair and efficient markets,” and is expected to release a report on the factors that influenced it.
NHTSA just released some specs. When you look at the second quarter of 2020, the first full quarter of the pandemic, total traffic deaths have decreased by three percent compared to the second quarter of 2019. That translates into 302 fewer fatalities than the same period last year. I’m not discounting that drop, since Each man’s death diminishes me, For I am involved in mankind. However, the traffic volume didn’t drop just three percent, it dropped more than 16 percent. There should have been a lot fewer deaths than there were. The difference is idiots like the one I encountered.
NHTSA said that because traffic volumes decreased more significantly than the number of fatal crashes, the traffic fatality rate per 100 million vehicle miles travelled is projected to increase to 1.25 in the first half of 2020, up from 1.06 in the same period in 2019.
A study using data from the Great Depression in the U.S. found that mortality decreased during this period, and life expectancy increased for all ages (except older ages), gender and race groups. Specifically, infant mortality and tuberculosis mortality declined, except in areas with extraordinarily high unemployment where malnutrition generally increased. This shows that procyclical effects dominated during this study period.1
There are a few arguments to explain this counter-intuitive effect, namely:
Economic expansions have been linked to increased smoking and alcohol consumption, reduction in sleep, increase in work stress and faster and more strenuous labour.
Mortality as a result of traffic and industrial injuries are clearly related to economic expansions.
Higher levels of economic activity may lead to increased atmospheric pollution, which has proven impacts on cardiovascular and respiratory mortality.
Influences such as increased social isolation, lack of homecare and decreased social support are known to be linked to increased employment, work pressure and higher level of work-related migration.2
White people received more than half of all vaccinations against COVID-19 during the first month of the rollout, according to data released Monday by the U.S. Centers for Disease Control and Prevention.
Just over 5% of the nearly 13 million people who received the shot between Dec. 14 and Jan. 14 people vaccinated against the coronavirus in the U.S. so far have been Black, and just under 12% were Hispanic, the data shows.
United Van Lines, the largest moving company in the United States, keeps track of its clients’ migration among the 48 contiguous states. It publishes that data each January, comparing the number of inbound moves to outbound moves for each state. As those who use United Van Lines are individuals and companies using large moving trucks, this data is only a subset of all moves, but the National Movers Study still provides a targeted look at the types of interstate migration patterns we can expect to see in government-issued data once it becomes available.
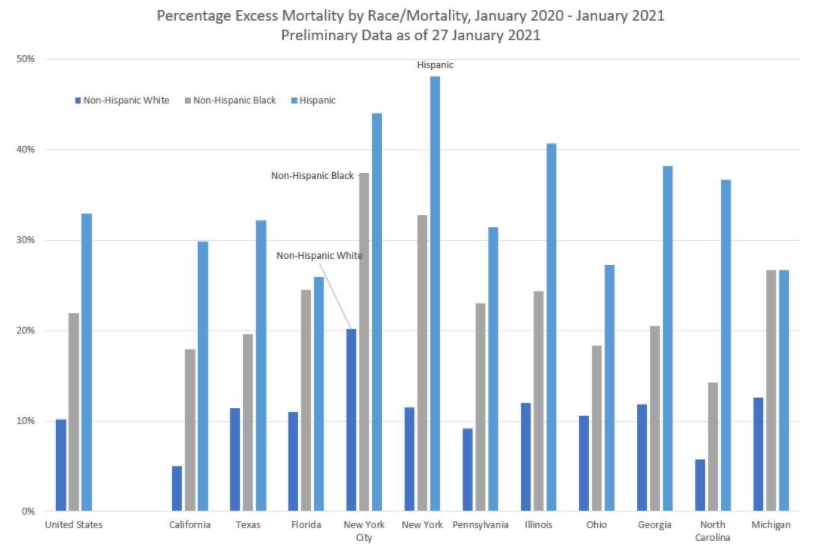
Overall, excess mortality (in a relative sense) for Hispanics is about three times than that seen by non-Hispanic Whites, and non-Hispanic Blacks have excess mortality about twice that of non-Hispanic Whites.
Note that New York City by itself has a very large amount of excess mortality. You can see why New York, as an area, reacted very drastically last year. When I saw the mortality spike coming from the city last year, I was just fine staying at home… because I could. The trade-offs have been relatively easy for me to see.
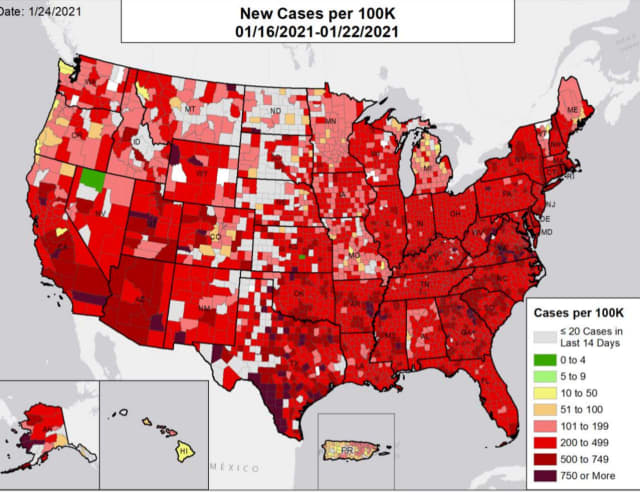
Three states have emerged as national hotspots for the spread of the COVID-19 virus, according to new data.
When new COVID-19 incident rates per 100,000 people were compared nationally, Arizona, South Carolina, and California were revealed to be the states with the highest risk for the transmission of COVID-19.