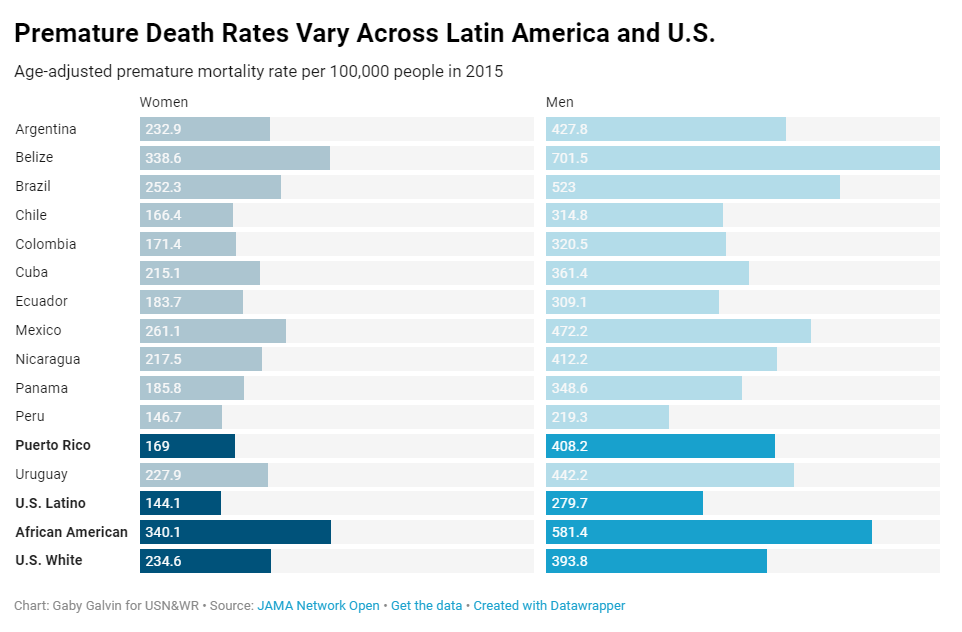
LATIN AMERICANS ARE less likely to die prematurely than non-Hispanic whites in the U.S. – whether they live in the country or not, a new study suggests.
Researchers have long theorized that a longer life expectancy among Latinos in the U.S. – despite often facing socioeconomic disadvantages – could be driven in part by a “healthy immigrant effect,” meaning healthier people may be more likely to immigrate to the U.S. than those in poorer health. But the new study, published Wednesday in JAMA Network Open, suggests “there may be a broader Latin American paradox” that extends far beyond U.S. borders.
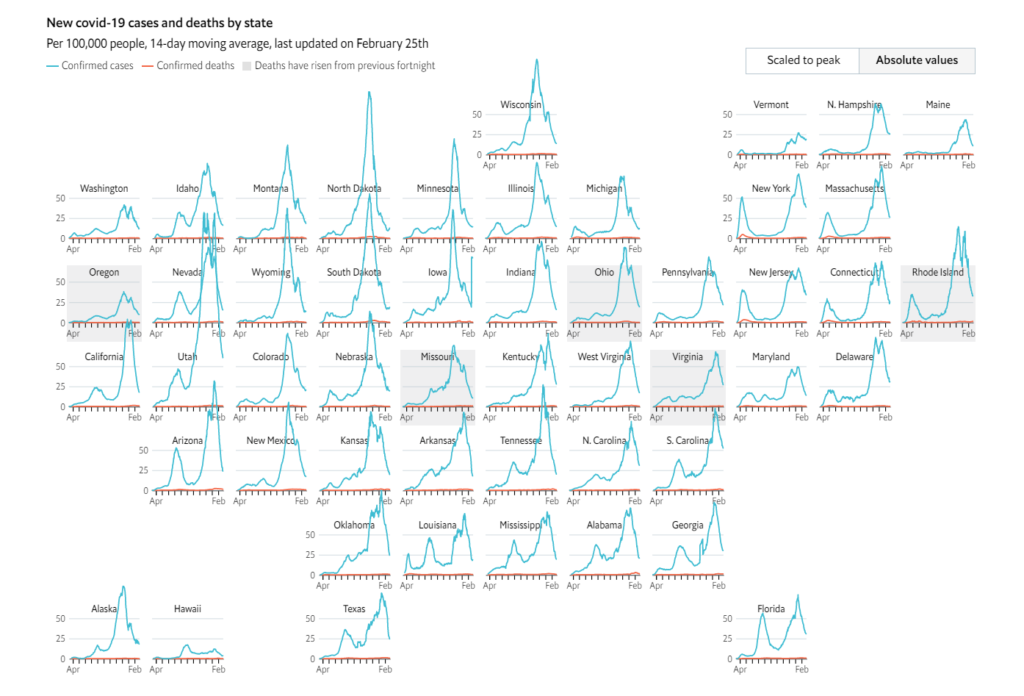
However, herd immunity will take months to achieve, and the sheer scale of infections in America dictates that covid-19 will not be under control for some time. In order to see where the pandemic is currently most severe across the nation, we have created an interactive map of covid-19 cases and deaths. It divides America into 500 areas. For each of these it shows cases and deaths per 100,000 people, so that infection and death rates in, say, New York City and its surrounds (population 40m) can be compared with those in Ironwood, Michigan (population 27,000).
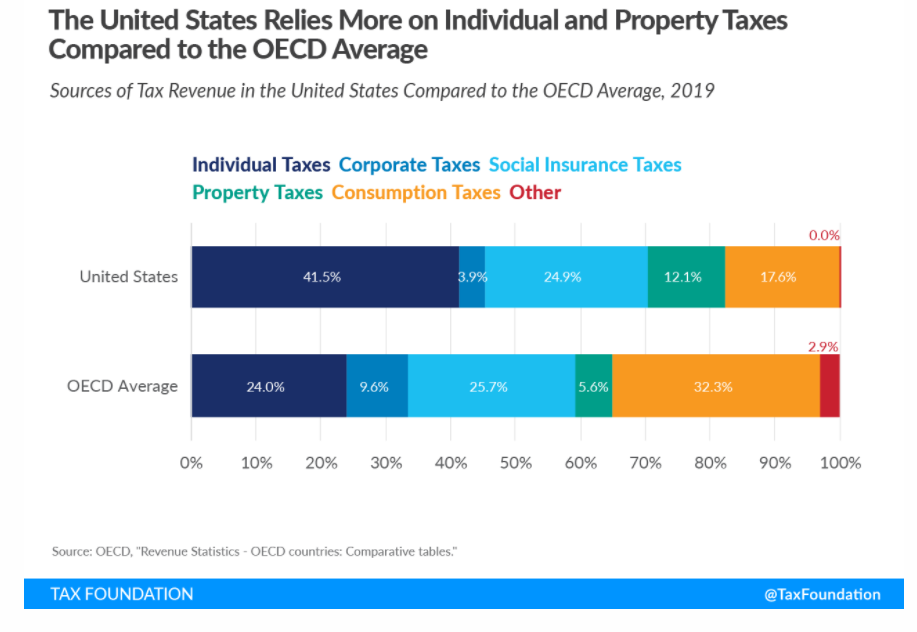
Compared to the OECD average, the United States relies significantly more on individual income taxes and property taxes. While OECD countries on average raised 24 percent of total tax revenue from individual income taxes, the share in the United States was 41.5 percent, a difference of 17.5 percentage points. This is partially because more than half of business income in the United States is reported on individual tax returns. OECD countries on average raised 5.6 percent of total tax revenue from property taxes, compared to 12.1 percent in the United States.
The United States relies much less on consumption taxes than other OECD countries. Taxes on goods and services accounted for only 17.6 percent of total tax revenue in the United States, compared to 32.3 percent in the OECD. This is because all OECD countries, except the United States, levy value-added taxes (VAT) at relatively high rates. State and local sales tax rates in the United States are relatively low by comparison.
Despite the stark difference in policy, both countries saw remarkably similar COVID-19 trends this winter. According to Worldometer’s numbers, the seven-day average of new cases peaked in the U.K. on January 9; it peaked in the U.S. two days later. That number then fell sharply in both countries. As of yesterday, it was down 81 percent in the U.K. and 73 percent in the U.S.
Daily deaths are also falling in both countries. As of yesterday, the seven-day average in the U.K. was down 61 percent from the peak on January 23. In the U.S., it was down 43 percent from the peak on January 26. Given the dramatic drop in daily new cases that began more than a month ago, daily deaths should continue to fall.
…..
The same story of starkly different policies and similar outcomes emerges from a comparison of Texas and California, the two most populous states. While California Gov. Gavin Newsom ordered a new lockdown on December 3, Texas Gov. Greg Abbott did not impose new restrictions, and the state remained largely open. Yet since mid-January, the two states have seen almost the same drop in the seven-day average of newly reported cases, which has fallen by 85 percent in California and 81 percent in Texas.
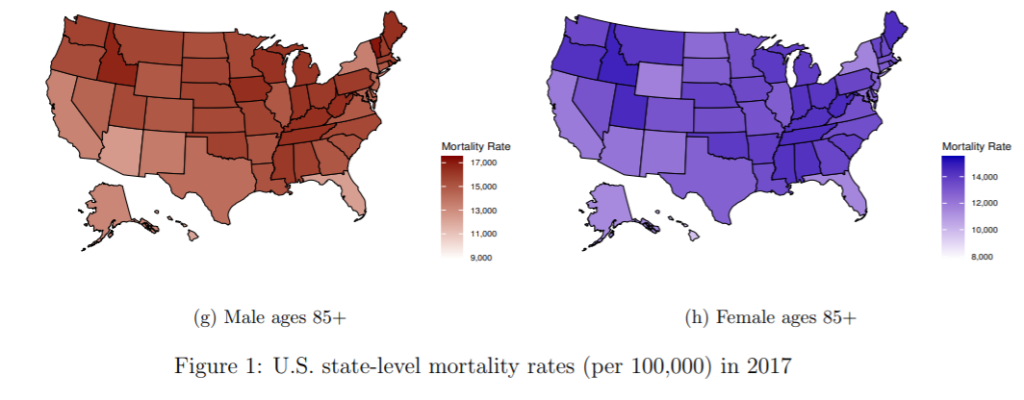
This paper investigates mortality inequality across U.S. states by modelling and forecasting mortality rates via a forecast reconciliation approach. Understanding the heterogeneity in state-level mortality experience is of fundamental importance, as it can assist decision-making for policy makers, health authorities, as well as local communities who are seeking to reduce inequalities and disparities in life expectancy. A key challenge of multi-population mortality modeling is high dimensionality, and the resulting complex dependence structures across sub-populations. Moreover, when projecting future mortality rates, it is important to ensure that the state-level forecasts are coherent with the national-level forecasts. We address these issues by first obtaining independent state-level forecasts based on classical stochastic mortality models, and then incorporating the dependence structure in the forecast reconciliation process. Both traditional bottom-up reconciliation and the cutting-edge trace minimization reconciliation methods are considered. Based on the U.S. total mortality data for the period 1969–2017, we project the 10-year-ahead mortality rates at both national-level and state-level up to 2027. We find that the geographical inequality in the longevity levels is likely to continue in the future, and the mortality improvement rates will tend to slow down in the coming decades.
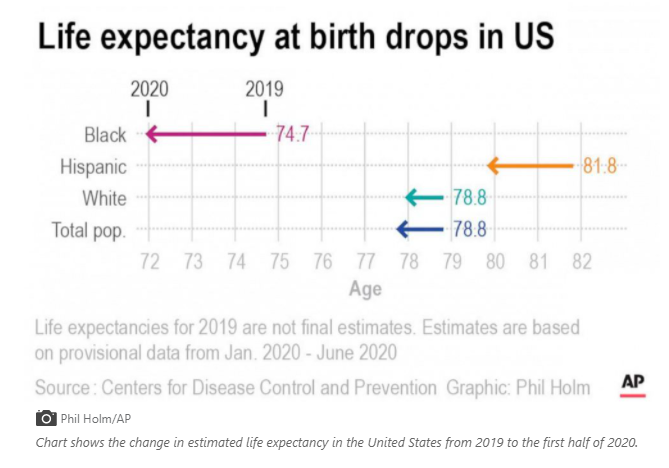
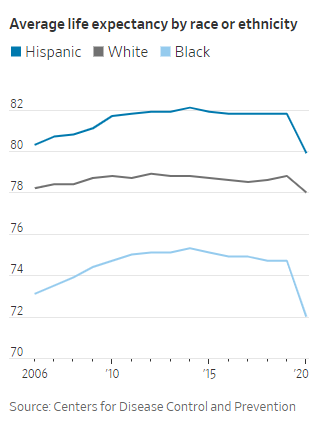
The decline in life expectancy was seen across racial and ethnic groups but was most severe in minorities, with Black Americans losing 2.7 years (from 74.7 to 72.0) and Hispanic Americans losing 1.9 years (from 81.8 to 79.9) during the same period. Meanwhile, white Americans lost less than a year (from 78.8 to 78.0), according to the report.
Hispanic Americans traditionally have the most longevity compared to other racial and ethnic groups in the U.S., and provisional estimates show they still do. Hispanics saw their “advantage” in this regard compared to Black Americans increase from 7.1 years in 2019 to 7.9. years in the first six months of 2020, the report said.
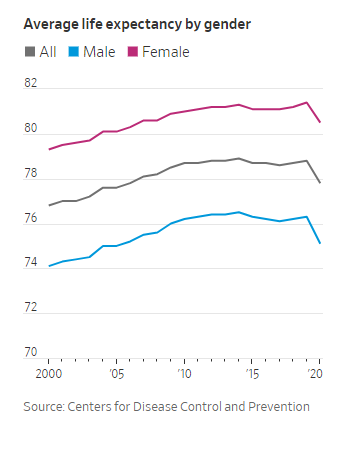
U.S. life expectancy declined by a year during the first half of 2020, according to federal figures released Thursday that show the deadly impact of the coronavirus pandemic’s early months.
The Centers for Disease Control and Prevention’s National Center for Health Statistics said life expectancy at birth was 77.8 years as of the end of June based on provisional estimates. The one-year decline from the previous year was the largest drop since World War II, when life expectancy fell 2.9 years between 1942 and 1943. It put life expectancy at its lowest level in the U.S. since 2006.
“It’s very concerning when we see mortality increase to such a degree,” said Elizabeth Arias, a health scientist at the center and a co-author of the report. “It gives you a clear picture of the magnitude of the effect of the Covid pandemic.”
Analysts at the Brookings Institution have predicted, based on consumer surveys and demographic data for the period following the 1918 influenza pandemic, that the number of U.S. births could fall by about 300,000 to 500,000 this year, because of health concerns and the effects of the pandemic on the economy.
MetLife has an indication that the Brookings analysts are correct: Enrollees in the group short-term disability plans MetLife runs for employers are filing fewer pregnancy-related STD claims.
MetLife sells employers group STD coverage, and it also administers group STD plans for employers that choose to self-insure.
STD claims for pregnancy-related leave fell 20% between the fourth quarter of 2019 and the fourth quarter of 2020, according to Phil Bruen, a senior vice president for group life and disability product management at MetLife.
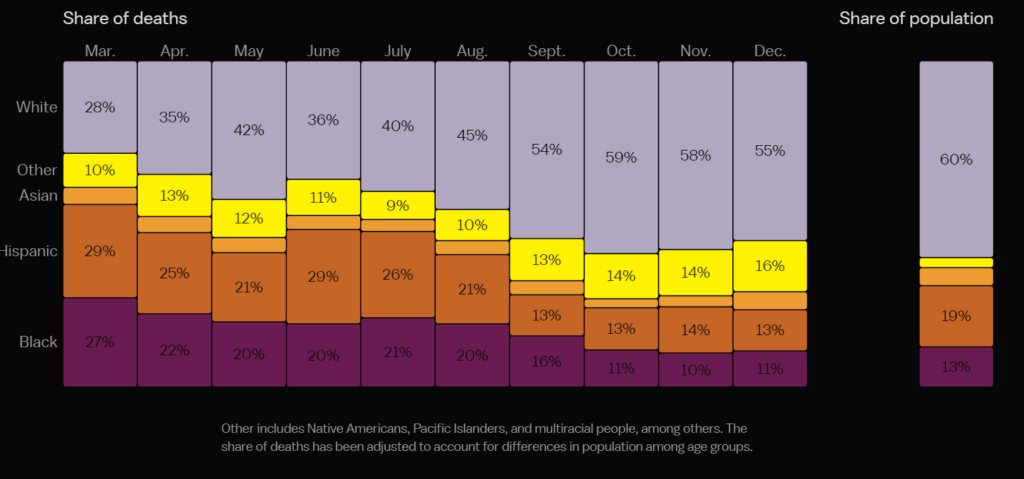
Death at this scale is difficult to comprehend, or visualize. To get a clearer sense of the shifting burden of Covid-19 deaths over time, Vox analyzed coronavirus mortality by age, region, and race from the past year, based on data from the Centers for Disease Control and Prevention and Johns Hopkins University.
We found that while Covid-19 spared no group, it impacted certain populations more than others. Throughout the pandemic, people of color have consistently been disproportionately sickened and killed by the virus. They also died young: Of Covid-19 deaths in people under the age of 45, more than 40 percent were Hispanic and about a quarter were Black.
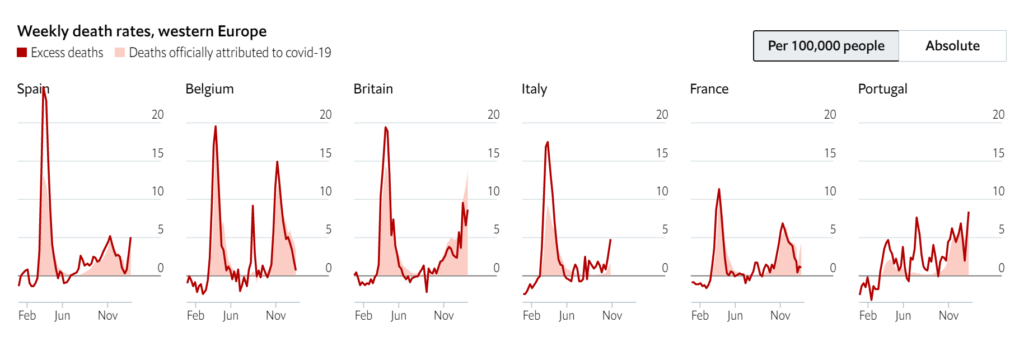
At the same time that covid-19 was devastating New York, cities in western Europe were also suffering severe outbreaks. Britain, Spain, Italy and Belgium have some of the highest national excess-death rates in the world, after adjusting for the size of their populations. France and Portugal locked down comparatively early, given the number of positive tests at the time. However, a second wave of covid-19 in winter has caused excess mortality to rise again across the region. (Some countries also recorded a small spike of non-covid fatalities during a heat wave in August.)
Spending by consumers who make less than $60,000 a year jumped by more than 20% in the week ended Jan. 10—the week after the U.S. Treasury Department began electronically sending stimulus payments of $600 per adult and $600 per child for individuals with adjusted gross incomes under $75,000—according to the research group Opportunity Insights’ tracker of figures from Affinity Solutions, which collects consumer credit- and debit-card spending data.
Federal authorities are investigating a massive counterfeit N95 mask operation in which fake 3M masks were sold in at least five states to hospitals, medical facilities and government agencies. The foreign-made knockoffs are becoming increasingly difficult to spot and could put health care workers at grave risk for the coronavirus.
These masks are giving first responders “a false sense of security,” said Steve Francis, assistant director for global trade investigations with the Homeland Security Department’s principal investigative arm. He added, “We’ve seen a lot of fraud and other illegal activity.”