What We’ve Learned — and Failed to Learn — from a Million COVID Deaths

Link: https://www.governing.com/now/what-weve-learned-and-failed-to-learn-from-a-million-covid-deaths

Excerpt:

The pandemic is not done. The number of new infections — surely an undercount due to unreported home tests — again tops 75,000 per day. The number of hospitalizations has climbed 20 percent over the past two weeks. The Biden administration has warned there could be 100 million more Americans infected by early next year. Yet Congress seems unwilling to provide more money for basic responses such as tests and vaccines, even as it becomes increasingly clear that even mild cases can lead to dangerous long-term damage.

Yet there are positive developments to consider as well. Vaccinations and certainly boosters are not where they should be, but three out of four Americans have received at least a single dose and two-thirds are fully vaccinated. The Commonwealth Fund has estimated that, absent vaccines, an additional 2.3 million Americans would have died, and 17 million more would have been hospitalized. Public health measures such as masking have largely fallen out of favor, but they helped prevent a death toll that could have been even more terrible.

“A million is way too many people, but as a result of the work that has been done, through public health and vaccination, it’s a number that’s a lot lower than it might have been,” says David Fleming, a distinguished visiting fellow at the Trust for America’s Health. “If we did not do those things, we would not be looking at the 1 million death threshold, we’d be looking at the 3 million death threshold.”

Author(s): Alan Greenblatt

Publication Date: 12 May 2022

Publication Site: Governing

The 5 Highest-Population States’ Current COVID-19 Mortality Picture

Link:https://www.thinkadvisor.com/2022/02/07/the-5-highest-population-states-current-covid-19-mortality-picture/

Graphic:

Excerpt:

Life insurers had hoped that vaccination campaigns, social distancing efforts and the effects of past COVID-19 infections on people’s immune systems would start to reduce the impact of the pandemic on people with commercial life insurance and other commercial insurance products.

While the fall 2021 surge was underway, information about deaths and life insurance claims emerged slowly. Some life insurers suggested that the fall surge seemed to be spiking hard but ending quickly.

Now, Unum GroupLincoln FinancialMetLife and other life insurers are saying that the fall surge did cause big increases in the ratio of death benefits to life insurance premiums. At Unum, for example, the ratio increased to 98.3% in the latest quarter, from 71.7% in the fourth quarter of 2019, before the pandemic began.

Author(s): Allison Bell

Publication Date: 7 Feb 2022

Publication Site: Think Advisor

U.S. Has Far Higher Covid Death Rate Than Other Wealthy Countries

Link:https://www.nytimes.com/interactive/2022/02/01/science/covid-deaths-united-states.html

Graphic:

Excerpt:

“We’ve finally started getting to a stage where most of the population has been exposed either to a vaccine or the virus multiple times by now,” said Dr. David Dowdy, an epidemiologist at the Johns Hopkins Bloomberg School of Public Health. Referring to American and European death rates, he continued, “I think we’re now likely to start seeing things be more synchronized going forward.”

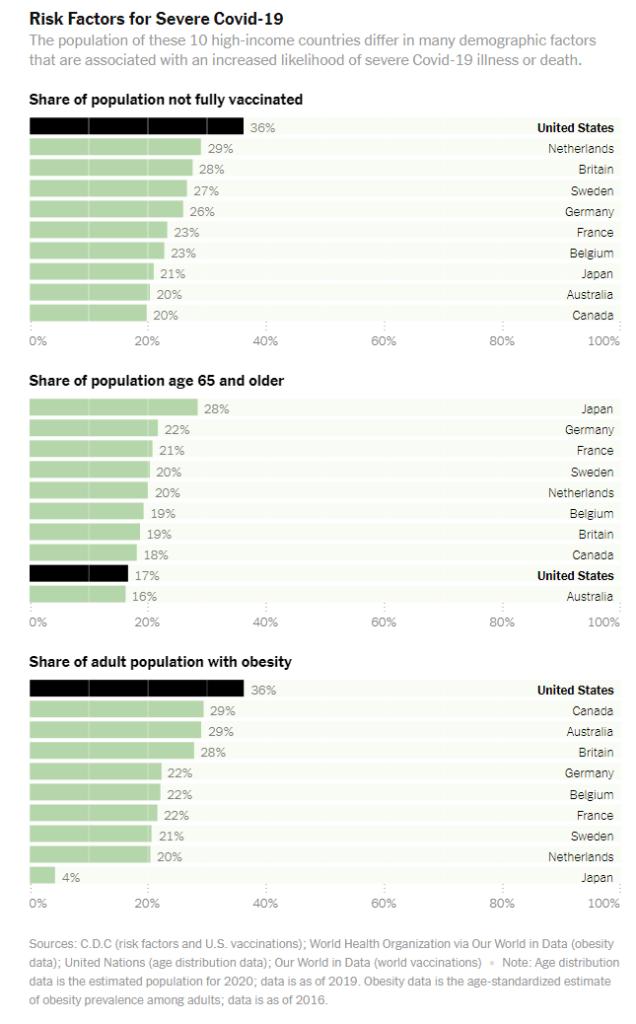
Still, the United States faces certain steep disadvantages, ones that experts worry could cause problems during future Covid waves, and even the next pandemic. Many Americans have health problems like obesity and diabetes that increase the risk of severe Covid.

Author(s): Benjamin Mueller and Eleanor Lutz

Publication Date: 1 Feb 2022

Publication Site: NYT

Annual Report on the Insurance Industry

Link:https://home.treasury.gov/system/files/311/FIO-2021-Annual-Report-Insurance-Industry.pdf

Graphic:

Excerpt:

Catastrophe losses of $61 billion in 2020 were notably more severe than in 2019, with a record number of
catastrophic events in the United States in 2020.46 Despite the more severe catastrophic event
losses, lower losses in personal and commercial auto and workers’ compensation lines kept total
loss and loss adjustment expenses flat from 2019 to 2020. Reserve development was again
favorable in 2020, adding to underwriting profits. Figure 24 shows losses from catastrophic
events in the United States since 2016, and Figure 25 shows reserve development over the same
period.47 The expense ratio decreased very slightly from 2019 to 2020.

Publication Date: September 2021

Publication Site: Federal Insurance Office

America’s pandemic is now an outlier in the rich world

Link:https://www.economist.com/graphic-detail/2021/09/27/americas-pandemic-is-now-an-outlier-in-the-rich-world

Graphic:

Excerpt:

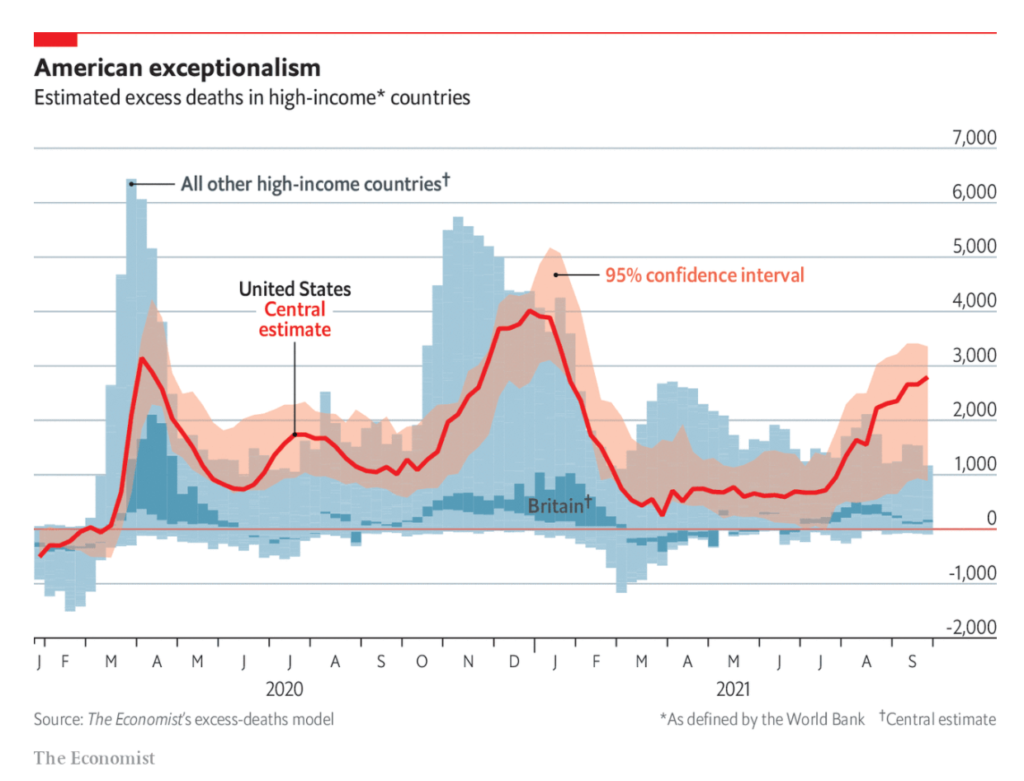
America is recording nearly 2,000 covid-19 deaths a day, according to a seven-day average compiled by Johns Hopkins University. That is only 40% below the country’s January peak. But the true death toll is even worse. The Economist’s excess-deaths model, which estimates the difference between the actual and the expected number of deaths recorded in a given period, suggests that America is suffering 2,800 pandemic deaths per day, with a plausible range of 900 to 3,300, compared with 1,000 (150 to 3,000) in all other high-income countries, as defined by the World Bank. Adjusting for population, the death rate is now about eight times higher in America than in the rest of the rich world.

Publication Date: 27 Sept 2021

Publication Site: The Economist

Inequality in Mortality between Black and White Americans by Age, Place, and Cause, and in Comparison to Europe, 1990-2018

Link:https://www.nber.org/papers/w29203

Graphic:

Excerpt:

Although there is a large gap between Black and White American life expectancies, the gap fell 48.9% between 1990-2018, mainly due to mortality declines among Black Americans. We examine age-specific mortality trends and racial gaps in life expectancy in rich and poor U.S. areas and with reference to six European countries.
Inequalities in life expectancy are starker in the U.S. than in Europe. In 1990 White Americans and Europeans in rich areas had similar overall life expectancy, while life expectancy for White Americans in poor areas was lower. But since then even rich White Americans have lost ground relative to Europeans. Meanwhile, the gap in life expectancy between Black Americans and Europeans decreased by 8.3%.
Black life expectancy increased more than White life expectancy in all U.S. areas, but improvements in poorer areas had the greatest impact on the racial life expectancy gap. The causes that contributed the most to Black mortality reductions included: Cancer, homicide, HIV, and causes originating in the fetal or infant period.
Life expectancy for both Black and White Americans plateaued or slightly declined after 2012, but this stalling was most evident among Black Americans even prior to the COVID-19 pandemic. If improvements had continued at the 1990-2012 rate, the racial gap in life expectancy would have closed by 2036. European life expectancy also stalled after 2014. Still, the comparison with Europe suggests that mortality rates of both Black and White Americans could fall much further across all ages and in both rich and poor areas.

Author(s): Hannes Schwandt, Janet Currie, Marlies Bär, James Banks, Paola Bertoli, Aline Bütikofer, Sarah Cattan, Beatrice Zong-Ying Chao, Claudia Costa, Libertad Gonzalez, Veronica Grembi, Kristiina Huttunen, René Karadakic, Lucy Kraftman, Sonya Krutikova, Stefano Lombardi, Peter Redler, Carlos Riumallo-Herl, Ana Rodríguez-González, Kjell Salvanes, Paula Santana, Josselin Thuilliez, Eddy van Doorslaer, Tom Van Ourti, Joachim Winter, Bram Wouterse & Amelie Wuppermann

DOI 10.3386/w29203

WORKING PAPER 29203

Publication Date: September 2021

Publication Site: NBER

COVID-19-Associated Orphanhood and Caregiver Death in the United States

Link:https://pediatrics.aappublications.org/content/pediatrics/early/2021/10/06/peds.2021-053760.full.pdf

Graphic:

Excerpt:

Methods: We quantified COVID-19-associated caregiver loss and orphanhood in the US and for
each state using fertility and excess and COVID-19 mortality data. We assessed burden and rates
of COVID-19-associated orphanhood and deaths of custodial and co-residing grandparents,
overall and by race/ethnicity. We further examined variations in COVID-19-associated
orphanhood by race/ethnicity for each state.


Results: We found that from April 1, 2020 through June 30, 2021, over 140,000 children in the
US experienced the death of a parent or grandparent caregiver. The risk of such loss was 1.1 to
4.5 times higher among children of racial and ethnic minorities, compared to Non-Hispanic
White children. The highest burden of COVID-19-associated death of parents and caregivers
occurred in Southern border states for Hispanic children, Southeastern states for Black children,
and in states with tribal areas for American Indian/Alaska Native populations.

Author(s): Hillis SD, Blenkinsop A, Villaveces A, et al.

Publication Date: 2021, accessed 12 Oct 2021

DOI: 10.1542/peds.2021-053760

Citation: Hillis SD, Blenkinsop A, Villaveces A, et al. COVID-19-associated orphanhood and
caregiver death in the United States. Pediatrics. 2021; doi: 10.1542/peds.2021-053760

Publication Site: Pediatrics

Mortality with Meep – Excess Deaths through September 2021 – Winter is Coming

Video description:

A look at the pattern of weekly deaths, all causes, for the entire United States through the beginning of September 2021, as well as: California Texas New York (minus NYC) New York City Pennsylvania Illinois CDC excess mortality dashboard: https://www.cdc.gov/nchs/nvss/vsrr/co…

Publication Date: 17 Sept 2021

Author: Mary Pat Campbell

Publication Site: Meep’s Math Matters at Youtube

Mortality Basics with Meep: Age-Adjusted Death Rates v. Crude Death Rates for U.S. 1968-2020

Link: https://marypatcampbell.substack.com/p/mortality-basics-with-meep-age-adjusted

Graphic:

Excerpt:

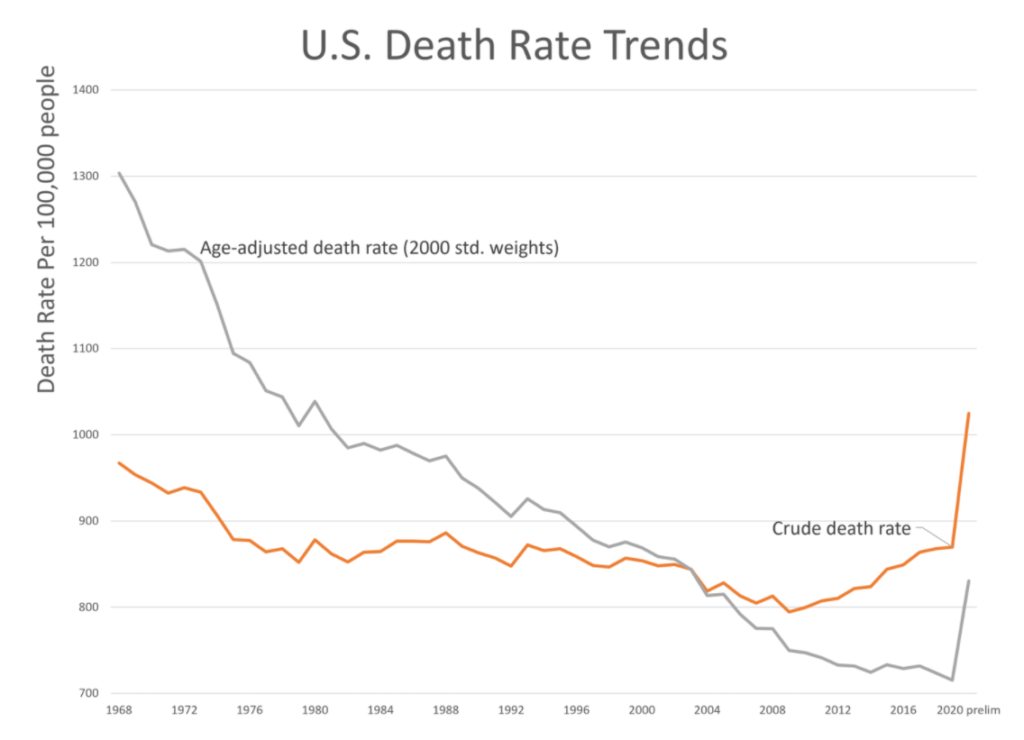
The crude death rate in 2019, pre-pandemic, was 870 per 100,000 people.

There was a similar crude death rate in 1989 (871 per 100,000) — do we really believe that the mortality experience, across the board, was the same thirty years apart?

This is the reason there is the same crude death rate in the two years: the age structure of the population was very different.

….

The main point, though, was that the population skewed younger in 1989 than in 2019. The median age in the U.S. was 38.4 in 2019. It was 32.9 years old in 1989.

In 1989, only 12.4% of the population was age 65 or older. In 2019, we had 16.5% of the population in that age bucket.

The changing age structure means that one can have mortality rates trending down for all ages, but the crude death rate climbs because the population is getting older. It’s definitely driven by people living longer (due to those lower mortality rates), but also driven by fewer babies being born.

Author(s): Mary Pat Campbell

Publication Date: 28 July 2021

Publication Site: STUMP at substack

Population Growth Sputters in Midwestern, Eastern States

Link: https://www.pewtrusts.org/en/research-and-analysis/articles/2021/07/27/population-growth-sputters-in-midwestern-eastern-states

Graphic:

Excerpt:

Apart from states with declines—West Virginia, Mississippi, and Illinois—the slowest population growth rates were recorded in Connecticut (0.09%); Michigan (0.19%); and Ohio, Wyoming, and Pennsylvania (0.23% each).

States experiencing their slowest decade of growth ever were Illinois, Connecticut, and six others: Missouri (0.27%), Wisconsin (0.36%), California (0.60%), Hawaii (0.68%), Arizona (1.13%), and Florida (1.37%).

After Utah, Idaho, and Texas, the next fastest-growing states over the past decade were North Dakota (1.48%), Nevada (1.40%), Colorado (1.39%), and Washington and Florida (both 1.37%).

Growth was faster in the 2010s than in the 2000s in only 12 states: Iowa, Louisiana, Massachusetts, Michigan, Nebraska, New Jersey, New York, North Dakota, Ohio, Rhode Island, South Dakota, and Washington.

Author(s): Barb Rosewicz, Melissa Maynard, Alexandre Fall

Publication Date: 27 July 2021

Publication Site: Pew

Why has America’s vaccination programme slowed so much?

Link: https://www.economist.com/graphic-detail/2021/07/08/why-has-americas-vaccination-programme-slowed-so-much?utm_campaign=the-economist-today&utm_medium=newsletter&utm_source=salesforce-marketing-cloud&utm_term=2021-07-08&utm_content=article-link-6&etear=nl_today_6

Graphic:

Excerpt:

ON JULY 4TH President Joe Biden stood on the White House lawn to declare that America was nearing independence from the coronavirus. But with covid-19 not fully “vanquished”, he called upon his fellow citizens to get vaccinated, telling them that “it’s the most patriotic thing you can do.” About 55% of Americans over the age of 12 have now been fully vaccinated, and a further 10% have had the first of two doses. But in recent weeks America’s vaccination rate has slowed markedly. In April 3m doses were administered each day; since June that figure has fallen to an average of 1m per day.

There are three possible explanations for this slow-down. The first is that it is typical for vaccination rates to fall as more people are jabbed, since those in cities and other easy-to-reach areas are likely to have been targeted already. Yet America does not appear to have reached such a threshold. Other rich countries, such as sparsely populated Canada, continued to vaccinate at a decent clip until about 75% of their populations had received their first dose (see left-hand chart). Germany, which has vaccinated a similar proportion of its citizens as America, is currently vaccinating at nearly three times the rate.

Publication Date: 8 July 2021

Publication Site: The Economist

5 U.S. States Where COVID-19 Slashed Birth Rates

Link: https://www.thinkadvisor.com/2021/07/06/5-u-s-states-where-covid-19-slashed-birth-rates/

Graphic:

Excerpt:

The pandemic has killed about 0.9% of Americans over age 65, and it has also reduced the number of babies born in 2020 by 4%, to 3.6 million, according to data from the National Center for Health Statistics.

That’s the biggest drop since 1973, when fear of overpopulation led many U.S. mothers to give up on the idea of having more than two children.

Author(s): Allison Bell

Publication Date: 6 July 2021

Publication Site: Think Advisor