Graphic:
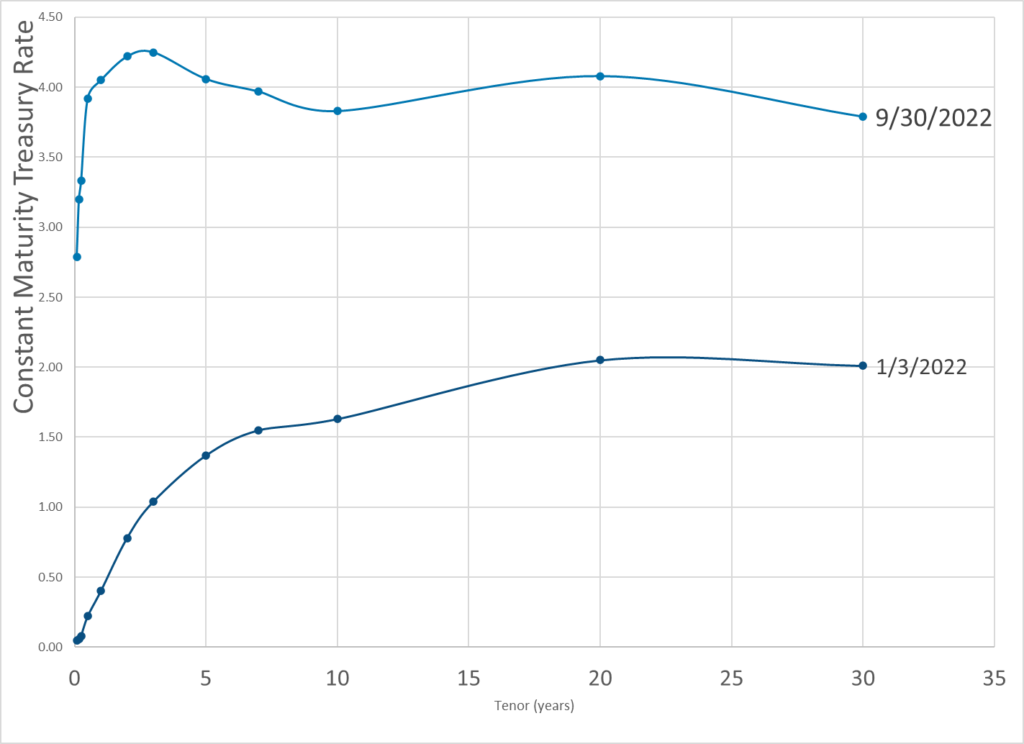
Publication Date: 30 Sept 2022
Publication Site: Dept of Treasury
All about risk
Graphic:

Publication Date: 30 Sept 2022
Publication Site: Dept of Treasury
Graphic:
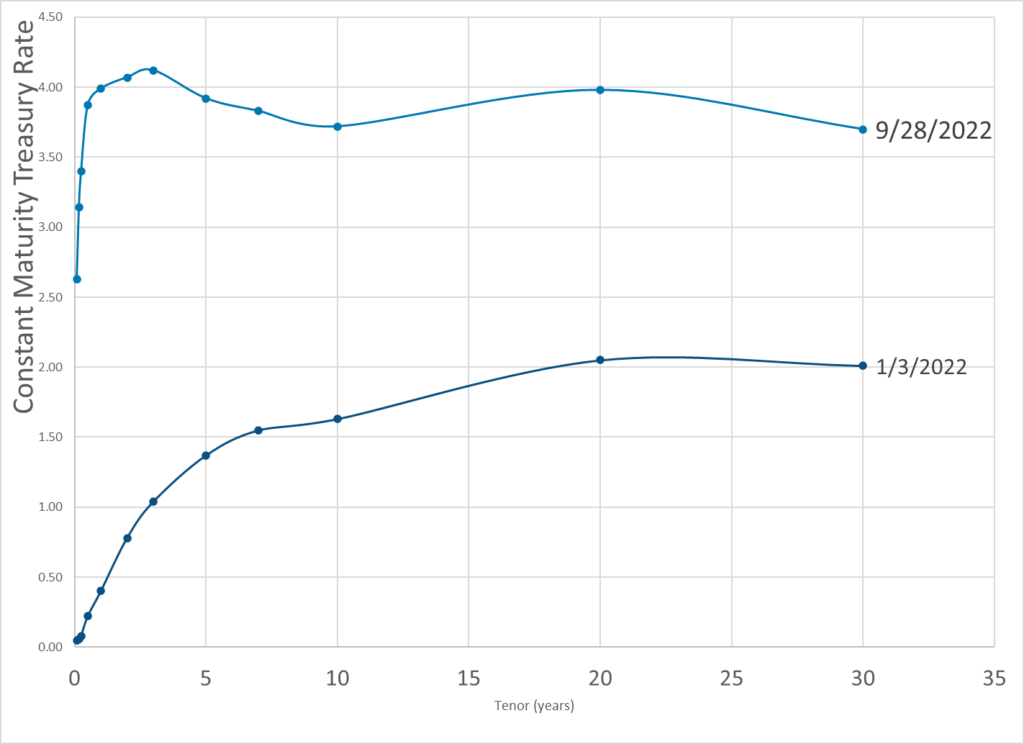
Publication Date: 28 Sept 2022
Publication Site: Dept of Treasury
Graphic:
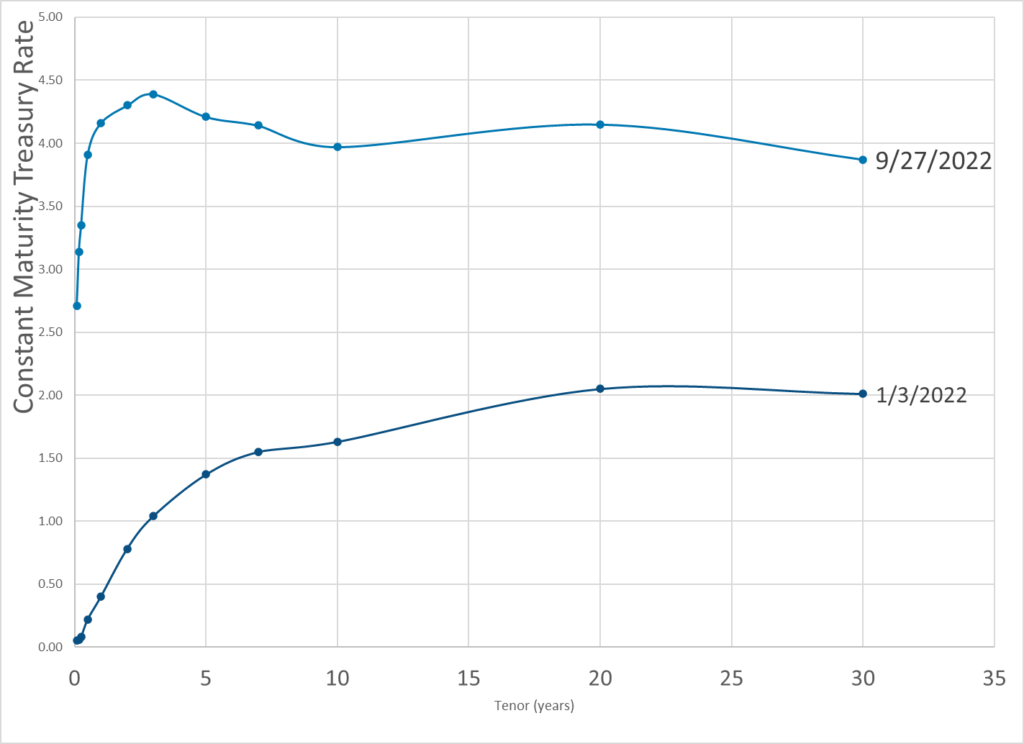
Publication Date: 27 Sept 2022
Publication Site: Department of Treasury
Graphic:
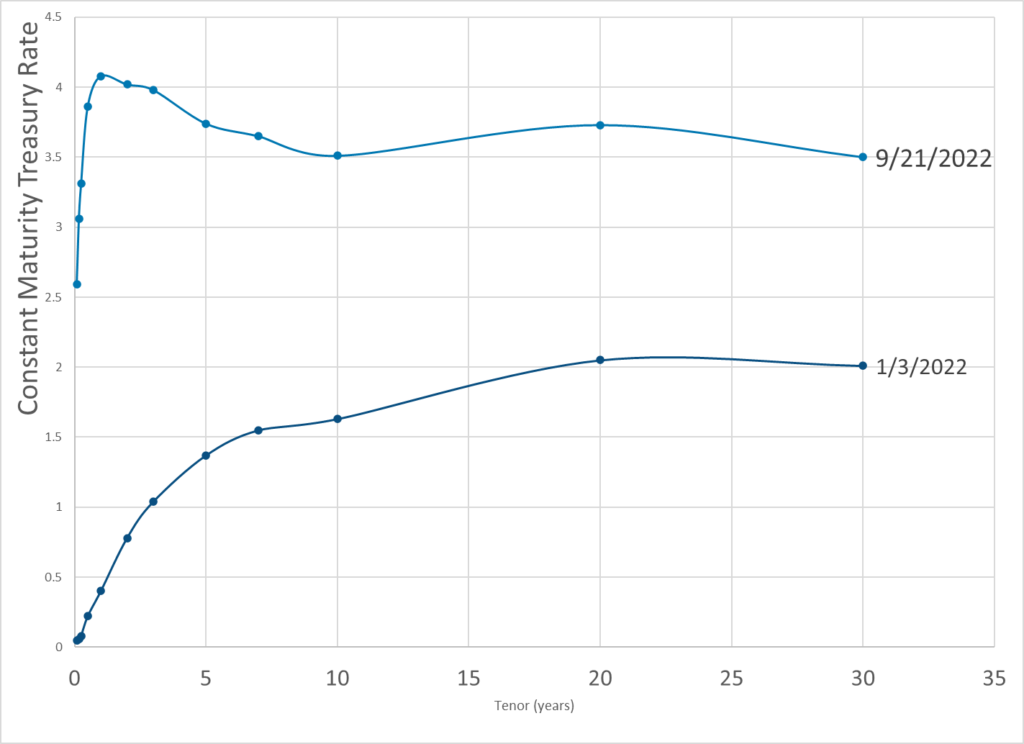
Publication Date: 22 Sept 2022
Publication Site: Dept of Treasury
Graphic:

Excerpt:
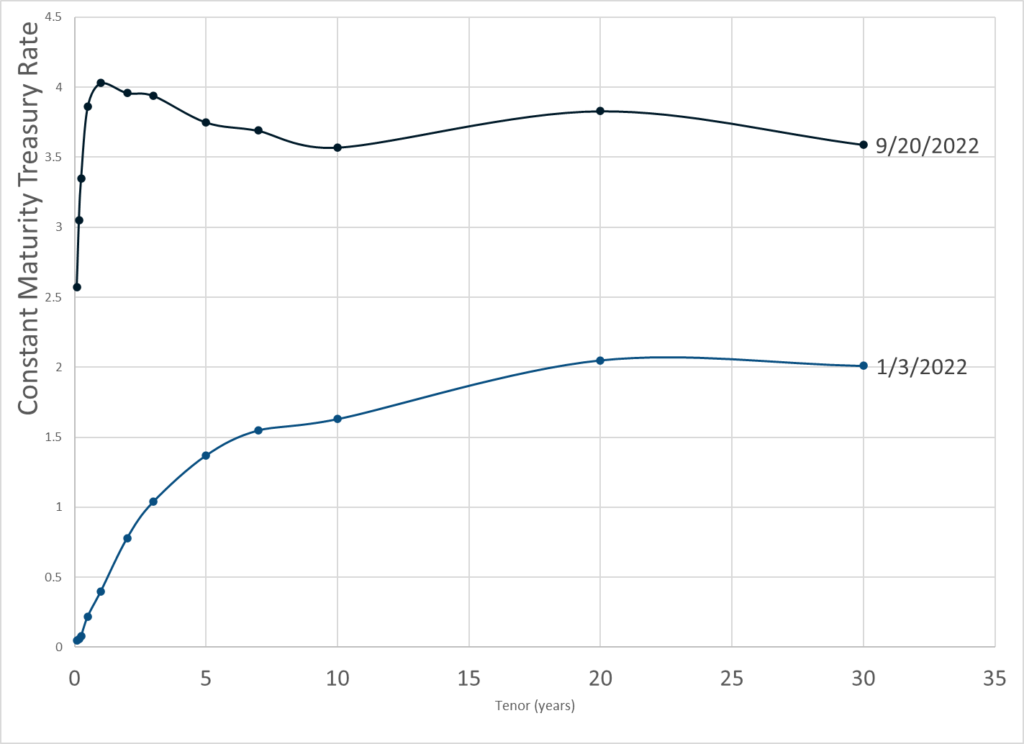
The curve has been inverted in places for over a year. This is a recession signal and I believe the economy went into recession in May.
The Fed is merrily hiking away and is likely to keep doing so until it breaks something big time. The Fed will hike 75 basis points tomorrow and the market thinks another 75 basis points is coming in November.
If so, it is doubtful the markets will like it much.
Author(s): Mike Shedlock
Publication Date: 20 Sept 2022
Publication Site: Mish Talk
Graphic:
Excerpt:
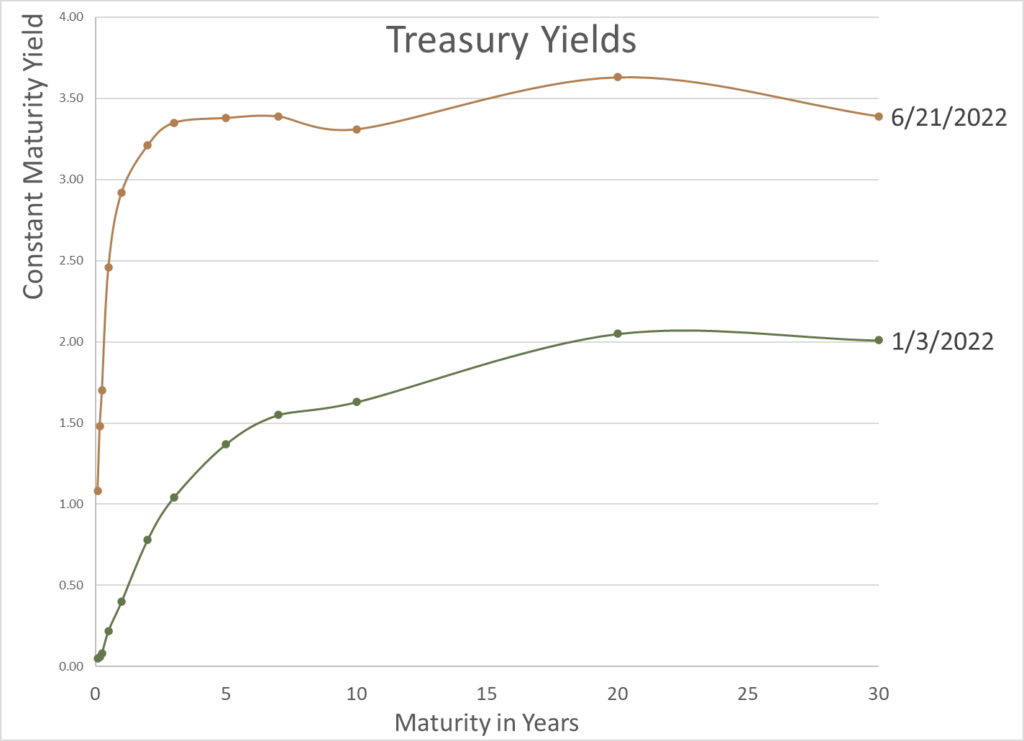
Treasury Par Yield Curve Rates: These rates are commonly referred to as “Constant Maturity Treasury” rates, or CMTs. Yields are interpolated by the Treasury from the daily par yield curve. This curve, which relates the yield on a security to its time to maturity, is based on the closing market bid prices on the most recently auctioned Treasury securities in the over-the-counter market. These par yields are derived from indicative, bid-side market price quotations (not actual transactions) obtained by the Federal Reserve Bank of New York at or near 3:30 PM each trading day. The CMT yield values are read from the par yield curve at fixed maturities, currently 1, 2, 3 and 6 months and 1, 2, 3, 5, 7, 10, 20, and 30 years. This method provides a par yield for a 10-year maturity, for example, even if no outstanding security has exactly 10 years remaining to maturity.
Treasury Par Yield Curve Methodology: The Treasury par yield curve is estimated daily using a monotone convex spline method. Inputs to the model are indicative bid-side prices for the most recently auctioned nominal Treasury securities. Treasury reserves the option to make changes to the yield curve as appropriate and in its sole discretion. See our Treasury Yield Curve Methodology page for details.
Author(s): Treasury Dept
Publication Date: 21 Sept 2022
Publication Site: Treasury Dept
Link: https://home.treasury.gov/resource-center/data-chart-center/interest-rates/
Graphic:
Publication Date: accessed 22 Jun 2022 6:19am ET
Publication Site: Treasury.gov
Link: https://www.nber.org/papers/w29902
Graphic:

PDF link: https://www.nber.org/system/files/working_papers/w29902/w29902.pdf
Abstract:
We use discounted cash flow analysis to measure a country’s fiscal capacity. Crucially, the discount rate applied to projected cash flows includes a GDP risk premium. We apply our valuation method to the CBO’s projections for the U.S. federal government’s deficit between 2022 and 2051 and debt in 2051. In spite of low rates, our current measure of U.S. fiscal capacity is lower than the debt/GDP ratio. Because of the backloading of projected surpluses, the duration of the surplus claim far exceeds the duration of the outstanding Treasury portfolio. This duration mismatch exposes the government to the risk of rising rates, which would trigger the need for higher tax revenue or lower spending. Reducing this risk by front-loading the surpluses also requires major fiscal adjustment.
Author(s): Zhengyang Jiang, Hanno Lustig, Stijn Van Nieuwerburgh & Mindy Z. Xiaolan
Publication Date: April 2022
Publication Site: NBER
DOI 10.3386/w29902
WORKING PAPER 29902
Excerpt:
Executives are hoping that Fed interest rate increases could increase the yields on insurers’ huge investment portfolios.
Higher rates could be a good thing for Prudential, the company’s vice chairman told analysts.
MetLife’s CEO said higher short-term rates could mean a flatter yield curve that would be less favorable to life insurers.
Author(s): Allison Bell
Publication Date: 4 Feb 2022
Publication Site: Think Advisor
Link: https://mishtalk.com/economics/the-fed-delivers-a-baby-gold-jumps
Graphic:
Excerpt:
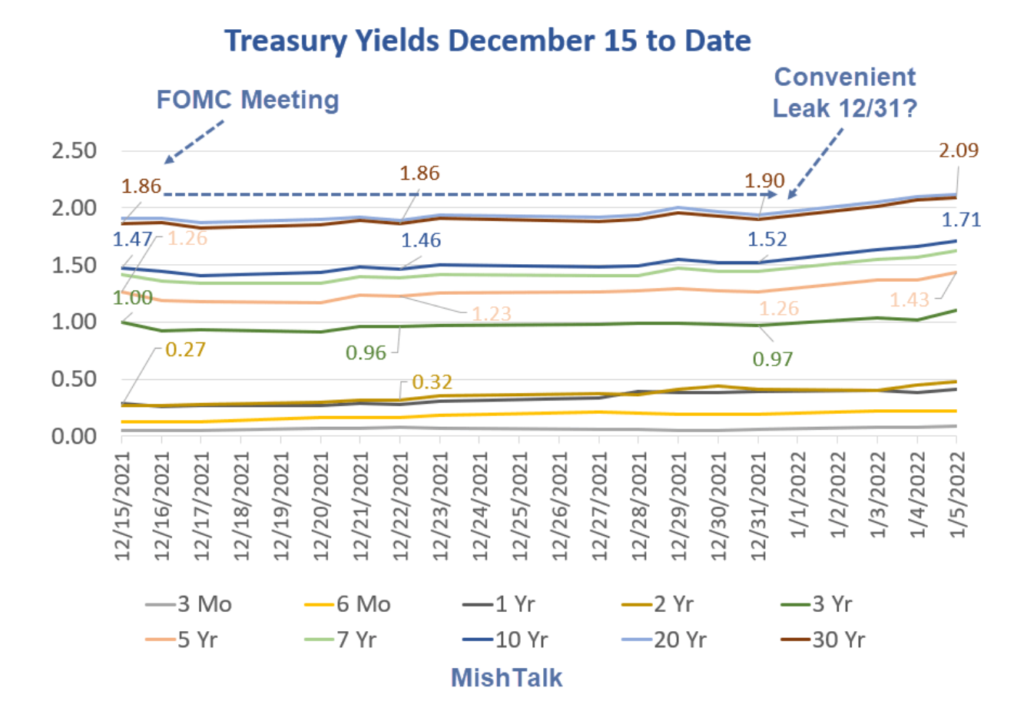
The Fed Delivers a Baby
Actually, it was obvious 7 months ago that it was time to move away from “emergency” conditions.
The Fed decided to deliver a baby instead.
In two more months, the Fed will finally finish tapering. Then we see what kind of baby steps the Fed makes.
Author(s): Mike Shedlock
Publication Date: 11 Jan 2022
Publication Site: Mish Talk
Link:https://www.wsj.com/articles/inflation-surge-whips-up-market-froth-11636817049
Excerpt:
Last week, real yields, which take into account the corrosive effects of inflation, hit some of their lowest levels on record. One measure of real yields, 10-year Treasury inflation-protected securities, fell to minus 1.2%, according to Tradeweb. That is the lowest on record, according to data going back to February 2003.
In essence, with real yields negative, the purchasing power of money invested will decline over the lifetime of those bonds.
Real yields have fallen because of colliding factors. These include the highest inflation rate in over three decades combined with nominal bond yields that have risen only modestly as central banks hold back from raising rates.
The prospect of negative returns on super safe inflation-protected bonds has pushed investors to buy riskier assets.
Author(s): Anna Hirtenstein
Publication Date: 14 Nov 2021
Publication Site: Wall Street Journal