Graphic:
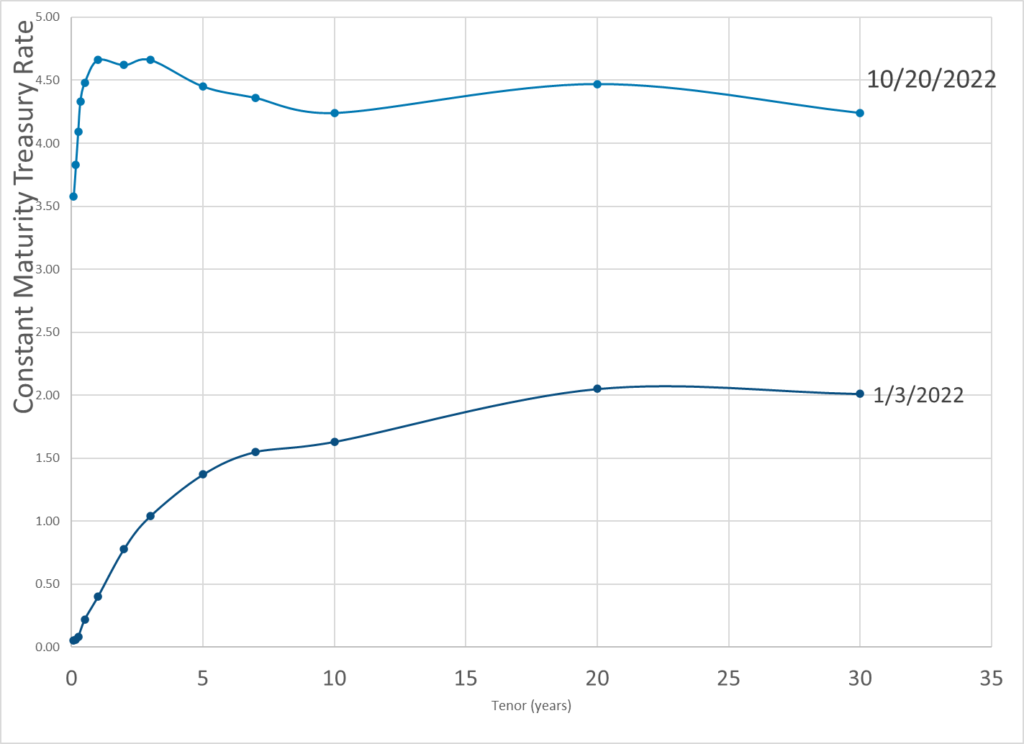
Publication Date: 20 Oct 2022
Publication Site: Dept of Treasury
All about risk
Graphic:

Publication Date: 20 Oct 2022
Publication Site: Dept of Treasury
Graphic:
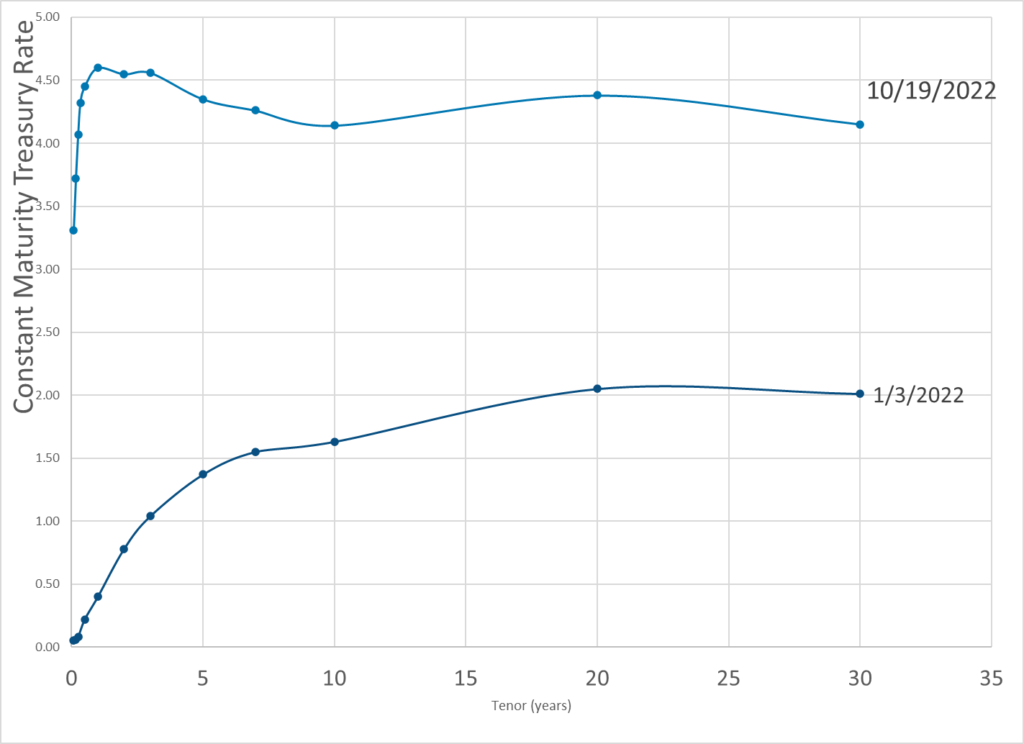
Publication Date: 19 Oct 2022
Publication Site: Dept of Treasury
Graphic:
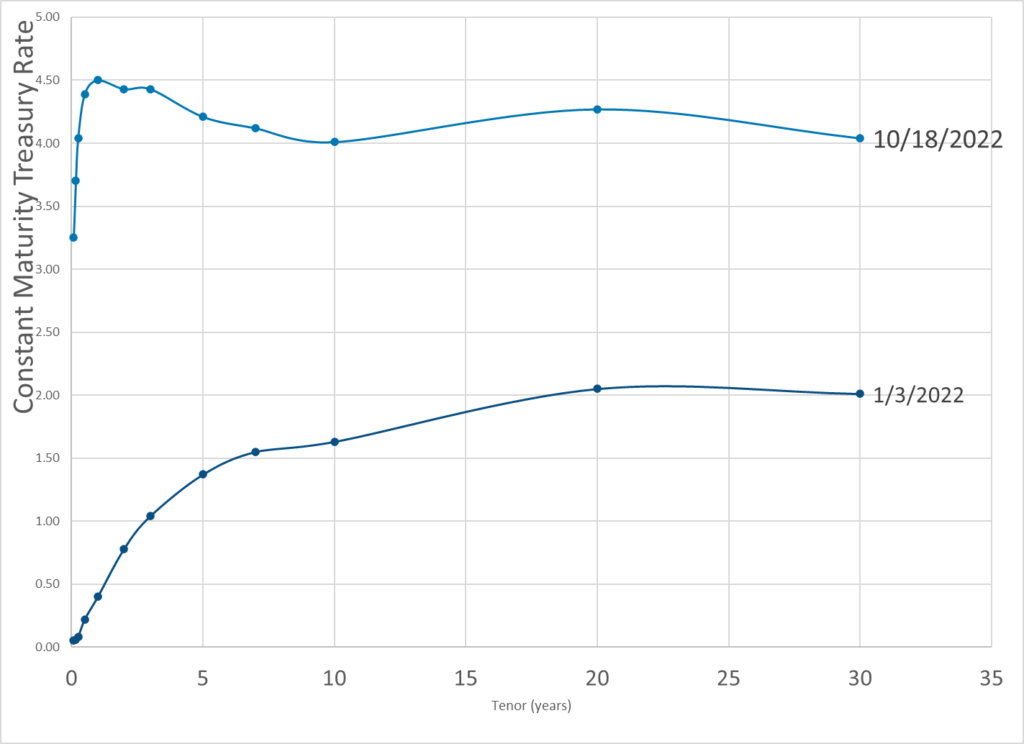
Publication Date: 18 Oct 2022
Publication Site: Dept of Treasury
Graphic:
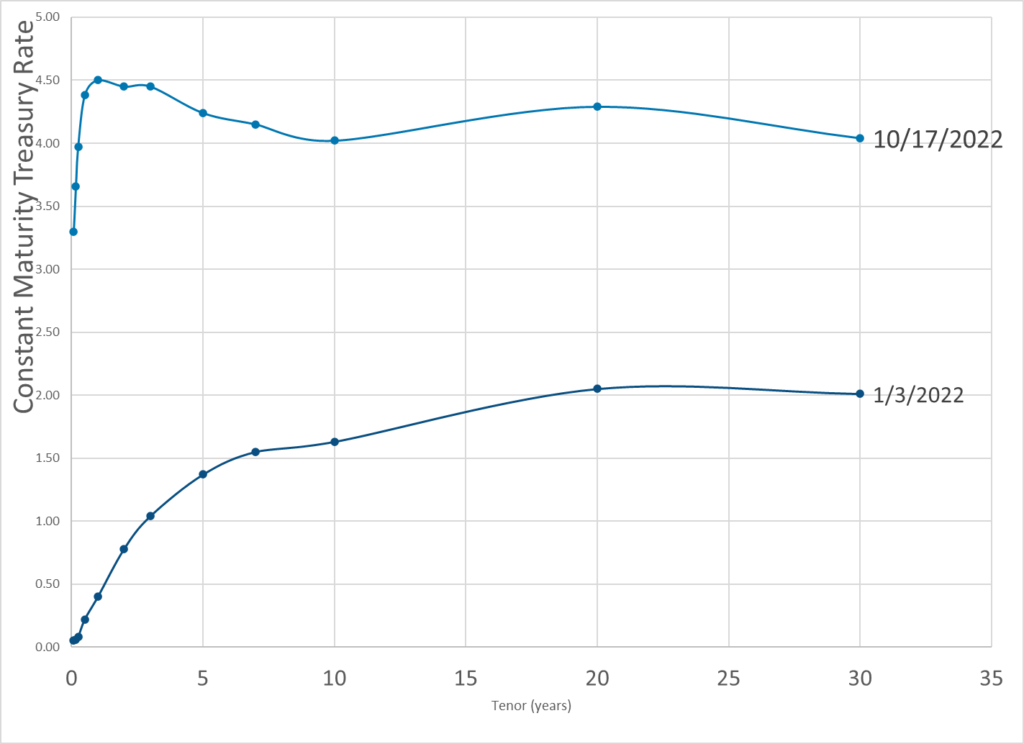
Publication Date: 17 Oct 2022
Publication Site: Dept of Treasury
Graphic:
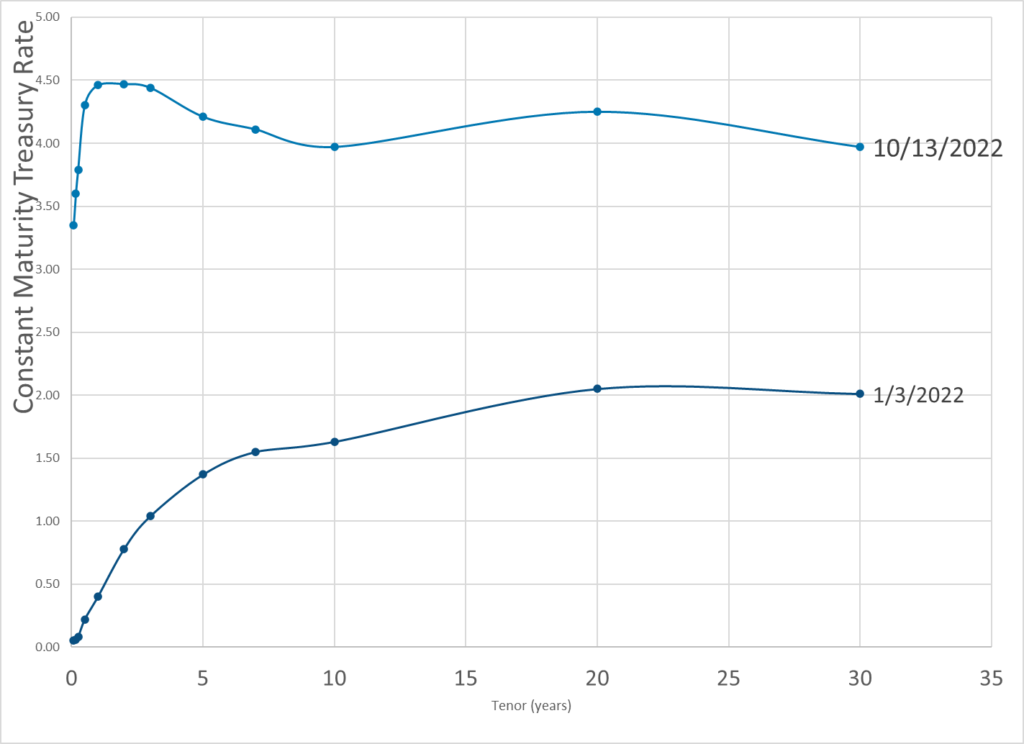
Publication Date: 13 Oct 2022
Publication Site: Dept of Treasury
Graphic:
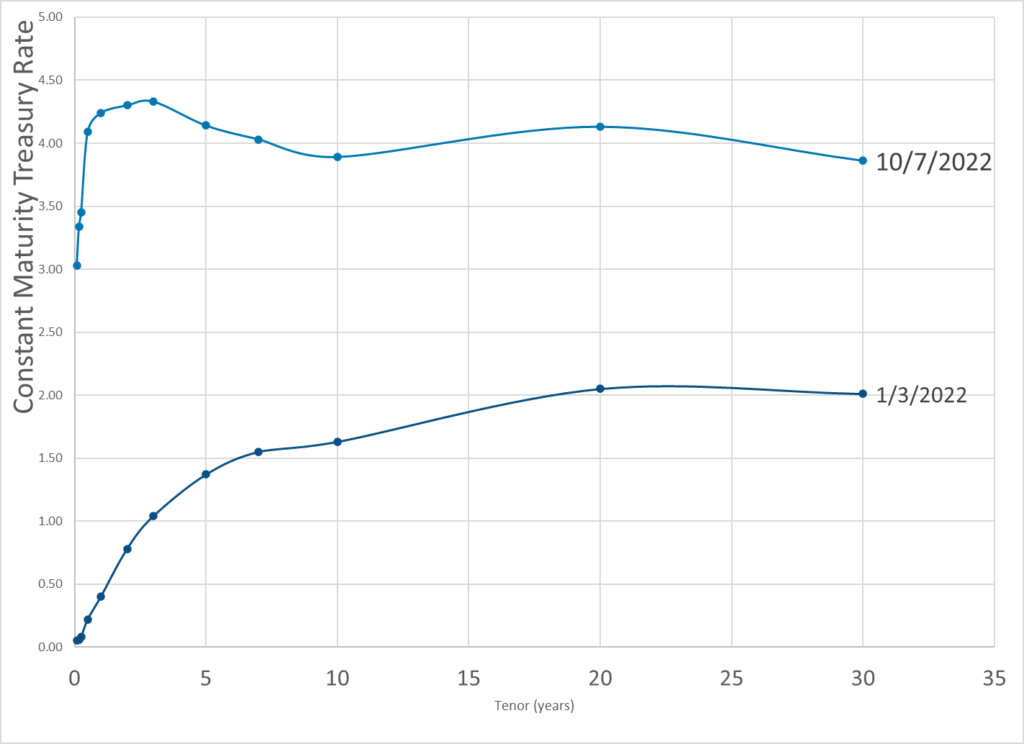
Publication Date: 7 Oct 2022
Publication Site: Dept of Treasury
Graphic:
Publication Date: 6 Oct 2022
Publication Site: Treasury Dept
Graphic:
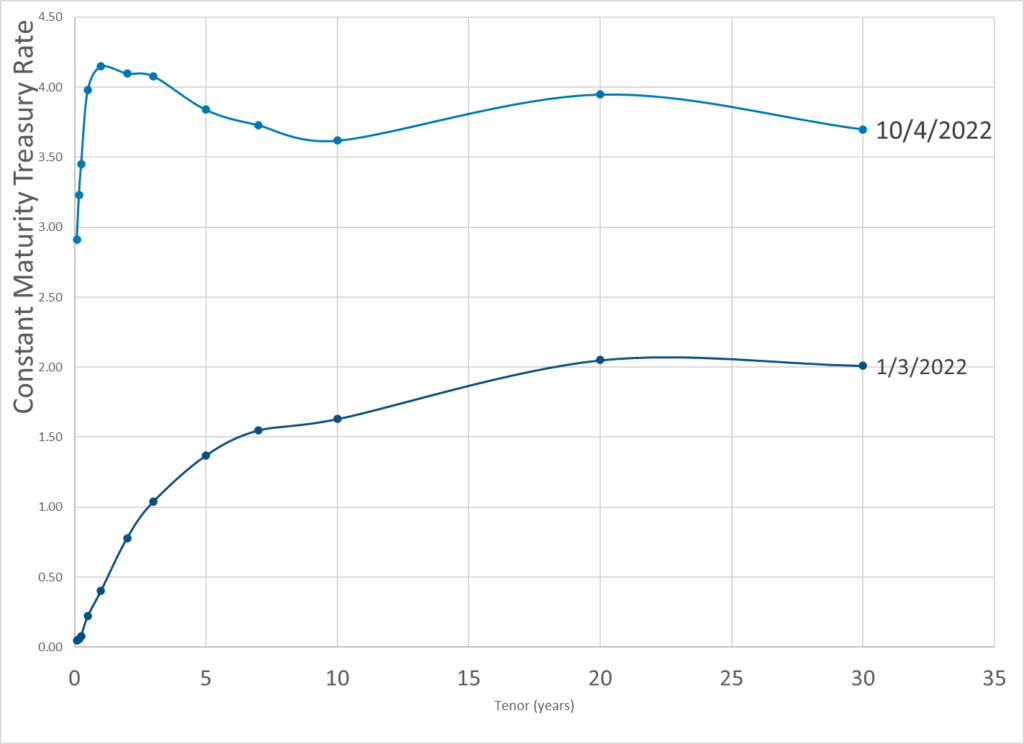
Publication Date: 4 Oct 2022
Publication Site: Dept of Treasury
Graphic:
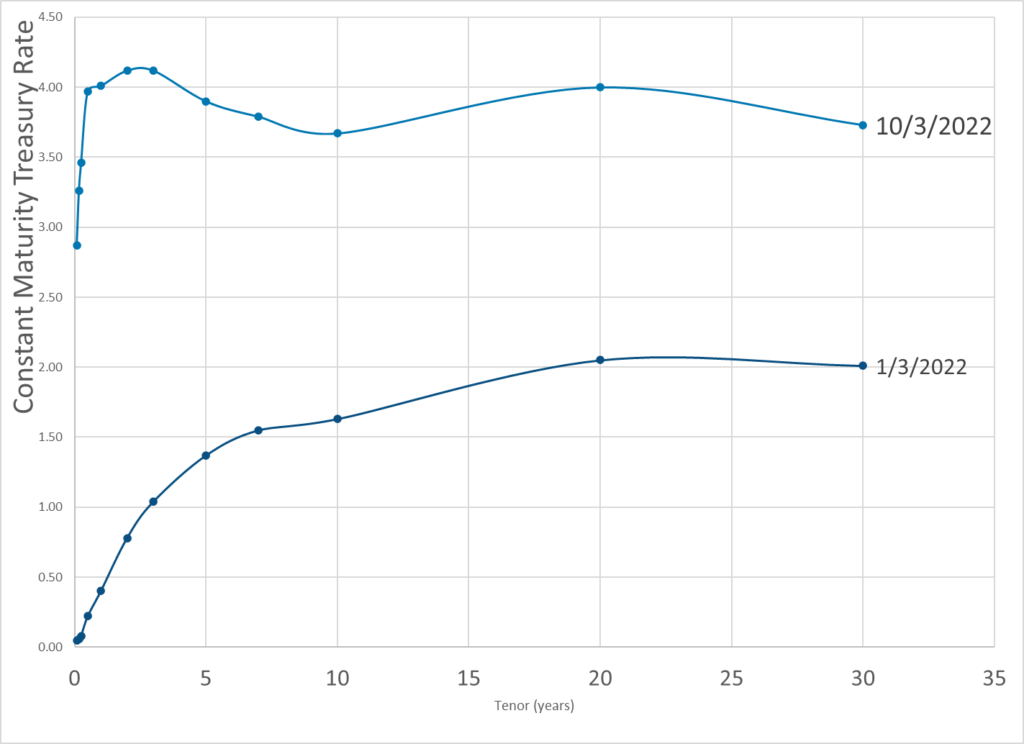
Publication Date: 3 Oct 2022
Publication Site: Treasury Dept
Graphic:
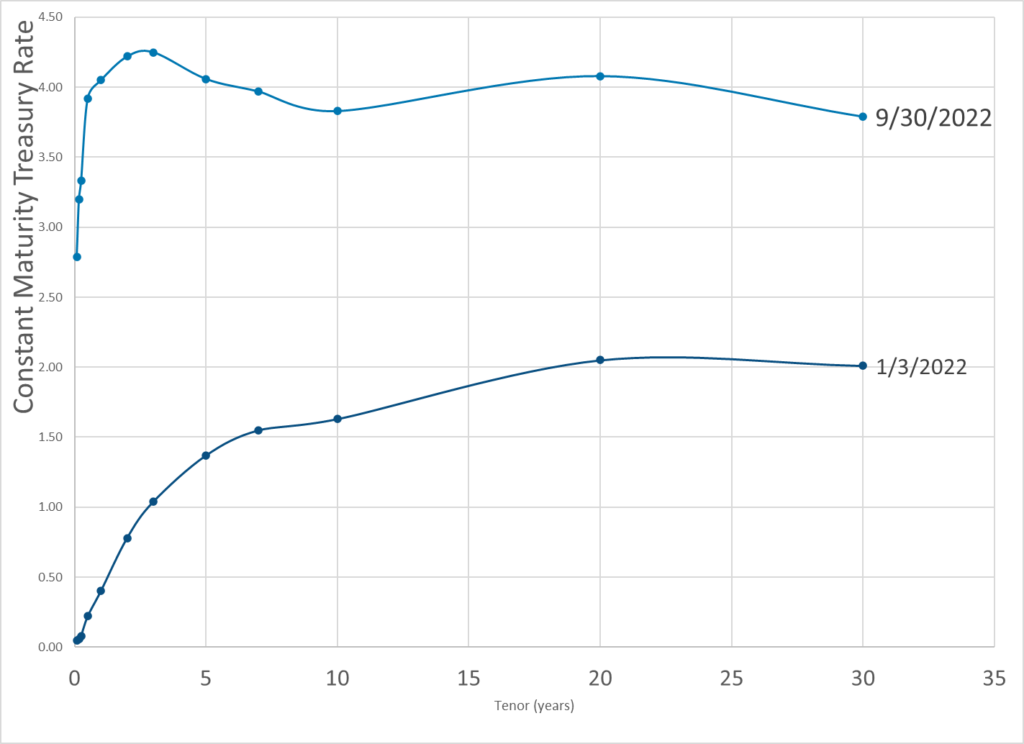
Publication Date: 30 Sept 2022
Publication Site: Dept of Treasury
Graphic:

Excerpt:
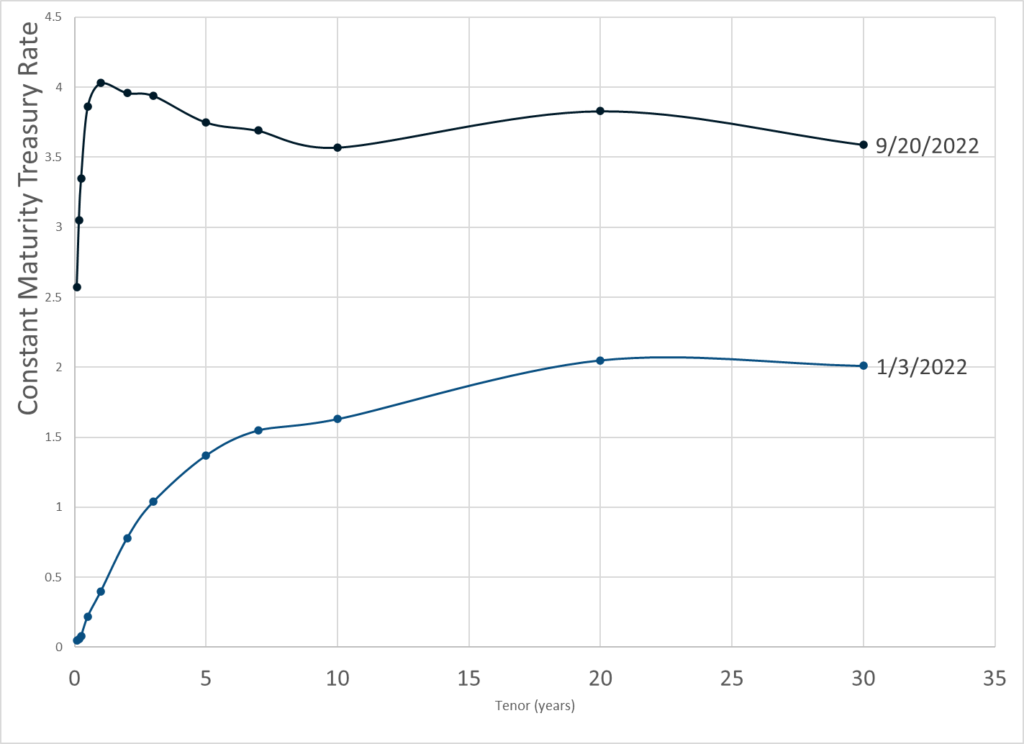
The curve has been inverted in places for over a year. This is a recession signal and I believe the economy went into recession in May.
The Fed is merrily hiking away and is likely to keep doing so until it breaks something big time. The Fed will hike 75 basis points tomorrow and the market thinks another 75 basis points is coming in November.
If so, it is doubtful the markets will like it much.
Author(s): Mike Shedlock
Publication Date: 20 Sept 2022
Publication Site: Mish Talk
Graphic:
Excerpt:
Treasury Par Yield Curve Rates: These rates are commonly referred to as “Constant Maturity Treasury” rates, or CMTs. Yields are interpolated by the Treasury from the daily par yield curve. This curve, which relates the yield on a security to its time to maturity, is based on the closing market bid prices on the most recently auctioned Treasury securities in the over-the-counter market. These par yields are derived from indicative, bid-side market price quotations (not actual transactions) obtained by the Federal Reserve Bank of New York at or near 3:30 PM each trading day. The CMT yield values are read from the par yield curve at fixed maturities, currently 1, 2, 3 and 6 months and 1, 2, 3, 5, 7, 10, 20, and 30 years. This method provides a par yield for a 10-year maturity, for example, even if no outstanding security has exactly 10 years remaining to maturity.
Treasury Par Yield Curve Methodology: The Treasury par yield curve is estimated daily using a monotone convex spline method. Inputs to the model are indicative bid-side prices for the most recently auctioned nominal Treasury securities. Treasury reserves the option to make changes to the yield curve as appropriate and in its sole discretion. See our Treasury Yield Curve Methodology page for details.
Author(s): Treasury Dept
Publication Date: 21 Sept 2022
Publication Site: Treasury Dept