State Individual Income Tax Rates and Brackets for 2021

Graphic:

Excerpt:

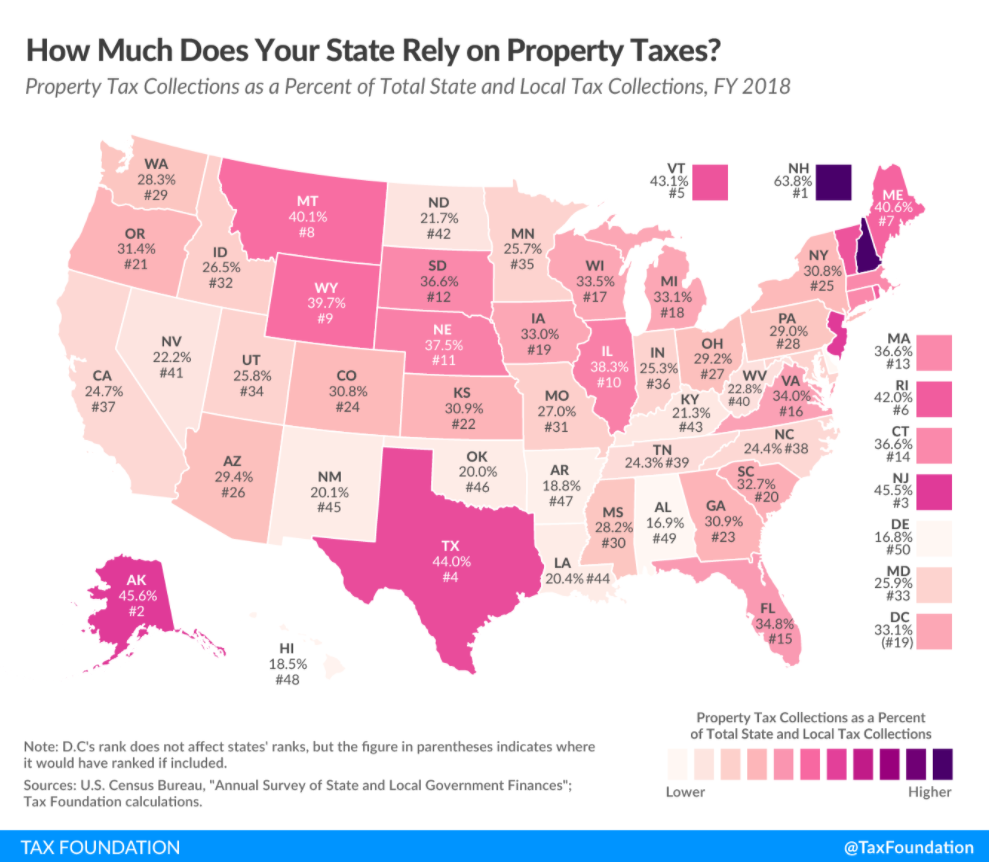
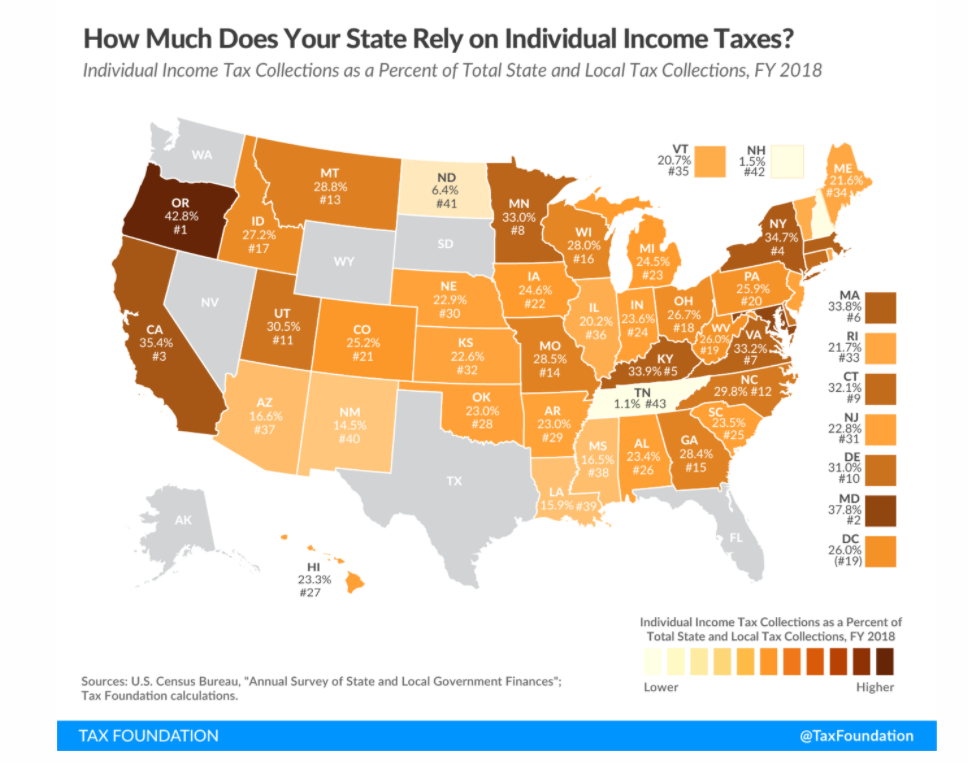
Individual income taxes are a major source of state government revenue, accounting for 38 percent of state tax collections in fiscal year 2018, the latest year of data available.

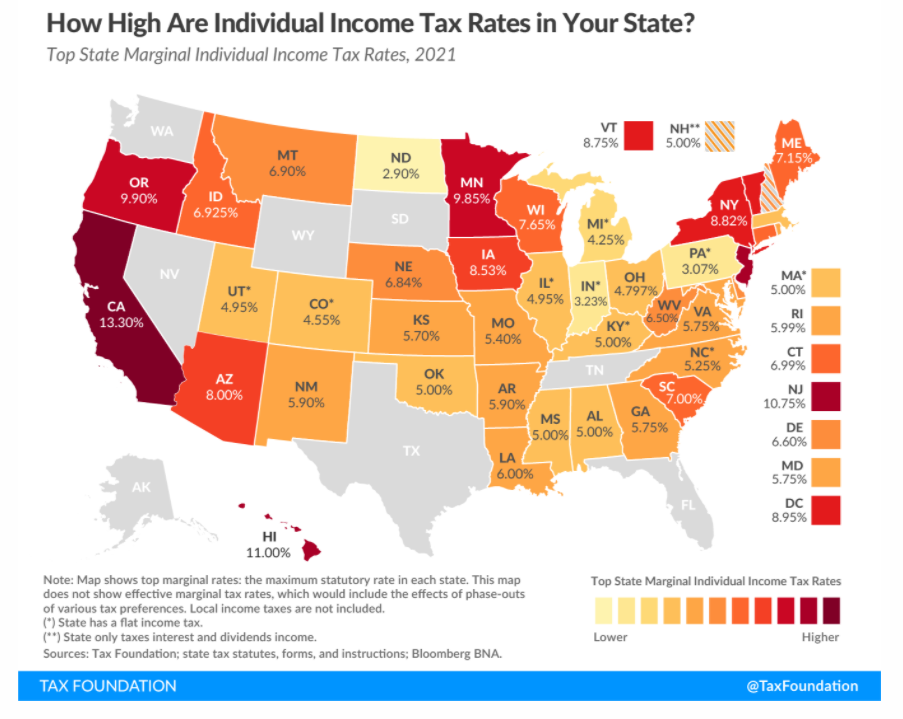
Forty-two states levy individual income taxes. Forty-one tax wage and salary income, while one state—New Hampshire—exclusively taxes dividend and interest income. Eight states levy no individual income tax at all.

Of those states taxing wages, nine have single-rate tax structures, with one rate applying to all taxable income. Conversely, 32 states and the District of Columbia levy graduated-rate income taxes, with the number of brackets varying widely by state. Hawaii has 12 brackets, the most in the country.

Author(s): Katherine Loughead

Publication Date: 17 February 2021

Publication Site: Tax Foundation

When ‘closing corporate loopholes’ goes wrong

Link: https://www.chicagobusiness.com/greg-hinz-politics/when-closing-corporate-loopholes-goes-wrong

Excerpt:

And that’s the context of that big $932 million tax hike on business Gov. J.B. Pritzker is pushing as part of his proposed 2022 budget.

Pritzker calls the proposal “closing corporate loopholes.” Arguably that’s true, at least in the sense that any tax break I don’t receive must be someone else’s undeserved loophole. But the proposal comes at the very time when population and jobs have begun to drop not only statewide but in the metropolitan area, and at a time when the state refuses to confront its ever-rising pension debt. Not to mention Chicago’s murder and car-jacking wave. Or what Cook County Assessor Fritz Kaegi is up to.

…..

In fairness to Pritzker, Illinois is not the only state to be moving its tax structure in his proposed direction, at least in part. For instance, according to the Tax Foundation, a Washington research group that’s fairly conservative but also frequently cited in economic circles, only 16 states grant the full accelerated depreciation that’s now in federal tax code. Pritzker’s proposed change there is worth $214 million a year.

Author(s): Greg Hinz

Publication Date:

Publication Site: Crain’s Chicago Business

Reliance on Social Insurance Tax Revenue in Europe

Graphic:

Excerpt:

A recent report on tax revenue sources shows that social insurance taxes—also referred to as social security contributions or payroll taxes—are an important revenue source for European governments. Social insurance taxes, as opposed to individual income taxes, are usually levied at a flat rate. The revenue is generally used to fund specific social programs, such as unemployment insurance, health insurance, and old age insurance.

In 2019 (the most recent data available), social insurance taxes were the second largest tax revenue source in European OECD countries, at an average of 29.5 percent of total tax revenue. Only consumption taxes were on average a larger source of tax revenue, at 32.4 percent.

Author(s): Elke Asen

Publication Date: 25 February 2021

Publication Site: Tax Foundation

Does Your State Have an Estate or Inheritance Tax?

Graphic:

Excerpt:

In addition to the federal estate tax, with a top rate of 40 percent, some states levy an additional estate or inheritance tax. Twelve states and the District of Columbia impose estate taxes and six impose inheritance taxes. Maryland is the only state to impose both.

Hawaii and Washington State have the highest estate tax top rates in the nation at 20 percent. Eight states and the District of Columbia are next with a top rate of 16 percent. Massachusetts and Oregon have the lowest exemption levels at $1 million, and Connecticut has the highest exemption level at $7.1 million.

Of the six states with inheritance taxes, Nebraska has the highest top rate at 18 percent. Maryland imposes the lowest top rate at 10 percent. All six states exempt spouses, and some fully or partially exempt immediate relatives.

Author(s): Janelle Cammenga

Publication Date: 24 February 2021

Publication Site: Tax Foundation

Sources of Tax Revenue: U.S. vs. OECD

Graphic:

Excerpt:

Compared to the OECD average, the United States relies significantly more on individual income taxes and property taxes. While OECD countries on average raised 24 percent of total tax revenue from individual income taxes, the share in the United States was 41.5 percent, a difference of 17.5 percentage points. This is partially because more than half of business income in the United States is reported on individual tax returns. OECD countries on average raised 5.6 percent of total tax revenue from property taxes, compared to 12.1 percent in the United States.

The United States relies much less on consumption taxes than other OECD countries. Taxes on goods and services accounted for only 17.6 percent of total tax revenue in the United States, compared to 32.3 percent in the OECD. This is because all OECD countries, except the United States, levy value-added taxes (VAT) at relatively high rates. State and local sales tax rates in the United States are relatively low by comparison.

Author(s): Cristina Enache

Publication Date: 17 February 2021

Publication Site: Tax Foundation

Sources of Government Revenue in the OECD

Graphic:

Excerpt:

When comparing average 2019 and 1990 OECD tax revenue sources, the most notable change is a decrease in individual income taxes versus increases in social insurance and consumption taxes. The share of revenues from corporate income taxes has also increased compared to 1990 (despite declining corporate income tax rates[4]). The relative importance of property taxes as a source of revenue has stayed roughly constant.

Author(s): Cristina Enache

Publication Date: 11 February 2021

Publication Site: Tax Foundation

To What Extent Does Your State Rely on Property Taxes?

Graphic:

Excerpt:

Property taxes represent a major source of revenue for states and the largest source of tax revenue for localities. In fiscal year 2018, the most recent data available, property taxes were such a significant source of local revenue that they accounted for 71.7 percent of local tax collections nationwide and 31.1 percent of total U.S. state and local tax collections, a greater proportion than any other source of tax revenue. In that same year, 25 states and the District of Columbia collected the greatest share of their combined state and local tax revenue from property taxes, with property taxes the largest share of local revenue in all but two states (Arkansas and Louisiana, both of which have high local sales taxes).

Author(s): Janelle Cammenga

Publication Date: 19 January 2021

Publication Site: Tax Foundation

To What Extent Does Your State Rely on Individual Income Taxes?

Graphic:

Excerpt:

Sources of state revenue have come under closer scrutiny in light of the impact of the coronavirus pandemic, as different tax types have differing volatility and economic impact—although even beyond these unique circumstances, it is important for policymakers to understand the trade-offs associated with different sources of tax revenue. This week’s map looks at what percentage of each state’s state and local tax collections is attributable to the individual income tax.

State and localities rely heavily on the individual income tax, which accounted for 24.2 percent of total U.S. state and local tax collections in fiscal year 2018, the latest year for which data are available. The individual income tax ranks just above the general sales tax (23.3 percent) and behind property taxes (31.1 percent), taking its place as the second largest source of state and local revenue.

Author(s): Janelle Cammenga

Publication Date: 10 February 2021

Publication Site: Tax Foundation

Where Did Americans Move in 2020?

Excerpt:

United Van Lines, the largest moving company in the United States, keeps track of its clients’ migration among the 48 contiguous states. It publishes that data each January, comparing the number of inbound moves to outbound moves for each state. As those who use United Van Lines are individuals and companies using large moving trucks, this data is only a subset of all moves, but the National Movers Study still provides a targeted look at the types of interstate migration patterns we can expect to see in government-issued data once it becomes available.

Author: Janelle Camanga

Publication Date: 31 January 2021

Publication Site: Tax Foundation