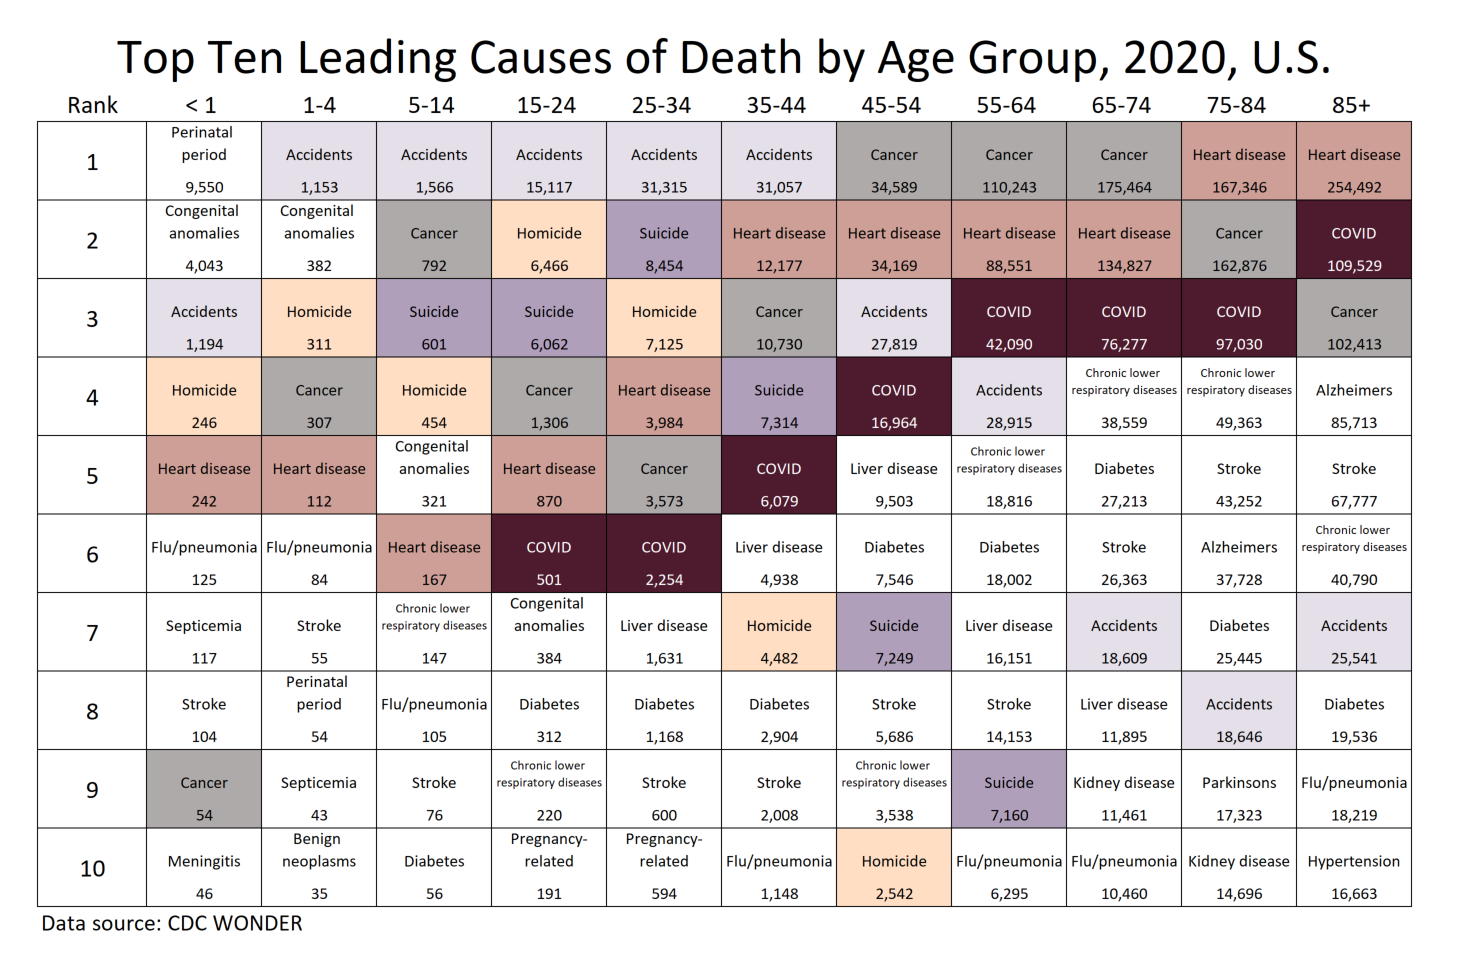
The numbers below each cause are the total number of finalized deaths in CDC Wonder as of 11 January 2022 for the completed calendar year 2020.
COVID deaths for under age 15 weren’t in the top 10 causes for those age groups, which is why they aren’t seen in the table. But you may be interested in those numbers: at #12 for ages 5-14, with 49 deaths at #12 for ages 1-4, with 19 deaths at #13 for infant mortality (<1 year), at 35 deaths
In general, other than the new cause of COVID, most of the causes of death were in the same rank order as in 2019, with a few switches for causes that tend to be close in numbers.
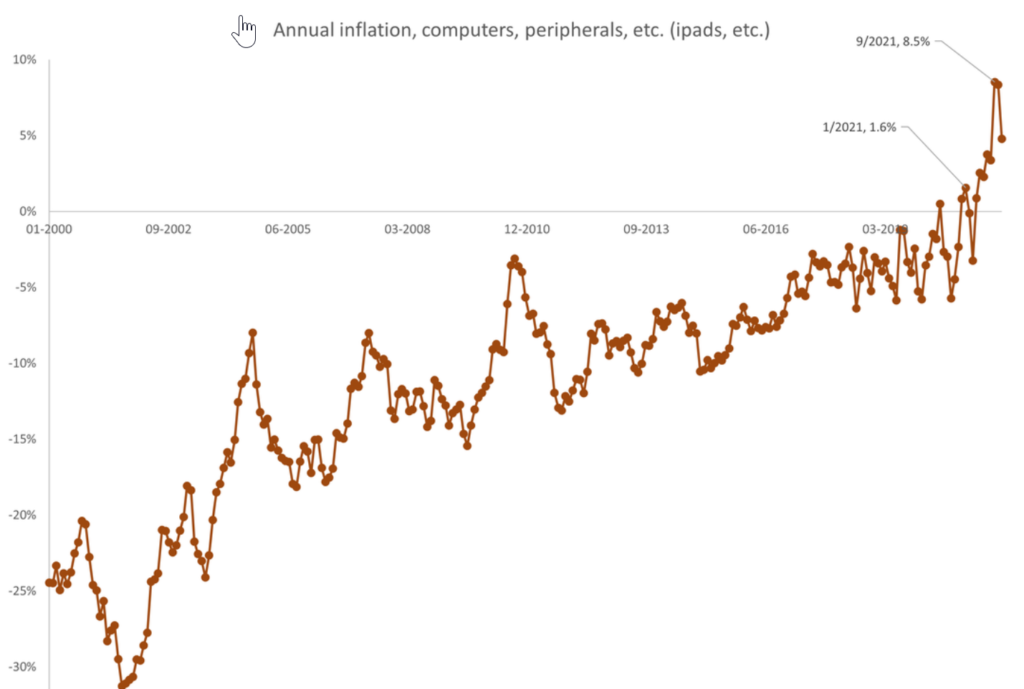
Productivity gains in consumer electronics have not been able to exceed the erosion of the currency’s value.
Bills such as Build Back Better are just a piece of the reason — we have more coming. We have a huge demographic issue, and a huge Social Security and Medicare bill not yet paid. Shoveling out more money and writing more IOUs will not help matters.
The pandemic created a lot of uncertainty around state and local government revenues for much of 2020. That was a big reason for the dramatic boost in the rate of bonds issued with insurance that year: In total, $34.45 billion in new bonds carried insurance — the highest since the Great Recession ended in 2009. Even with the economic stabilization this year, insurance is still going strong. Through October 2021, wrapped municipal bond issuance totaled $31.5 billion, according to RBC Capital Markets.
Looking ahead, the chatter about municipal climate risk has been increasing in recent years. Extreme weather events linked to climate change have called into question the preparedness and resiliency of utilities and other government issuers, while studies point to the potential long-term economic effect. One BlackRock Investment Institute report estimated that some vulnerable cities could see economic losses of up to 10% of GDP without decisive action.
The bottom line: Insurance provided safety for muni market investors during the pandemic and its continued use indicates that investors and issuers are both finding it attractive in situations where there might be a little more long-term uncertainty. Climate risk plays right into this notion. While no one expects bond insurance to dominate the market as it once did, it’s likely that the pandemic spike in usage is here to stay.
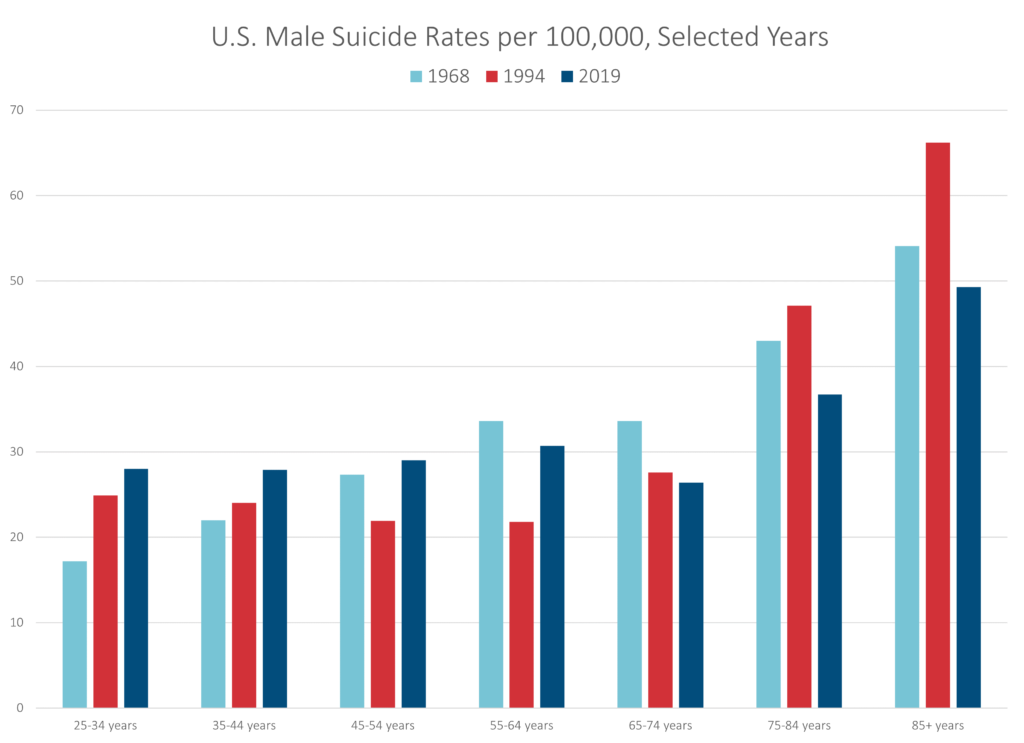
Let’s look at the rate trend for those over age 55 — the suicide death rates in 2019 are lower than they were in 1968. There has been an improvement.
But under age 55, we have a different story.
Indeed, from age 25 to 64, we see a flattening of the suicide death rate, as we have a rate in 1968 which was fairly low rising up to a level similar to that of much older men.
As I’ve said about other mortality trends — in many cases, I can’t tell you why this is happening. I don’t know. I can just see that it is happening. And I would like to do something about it.
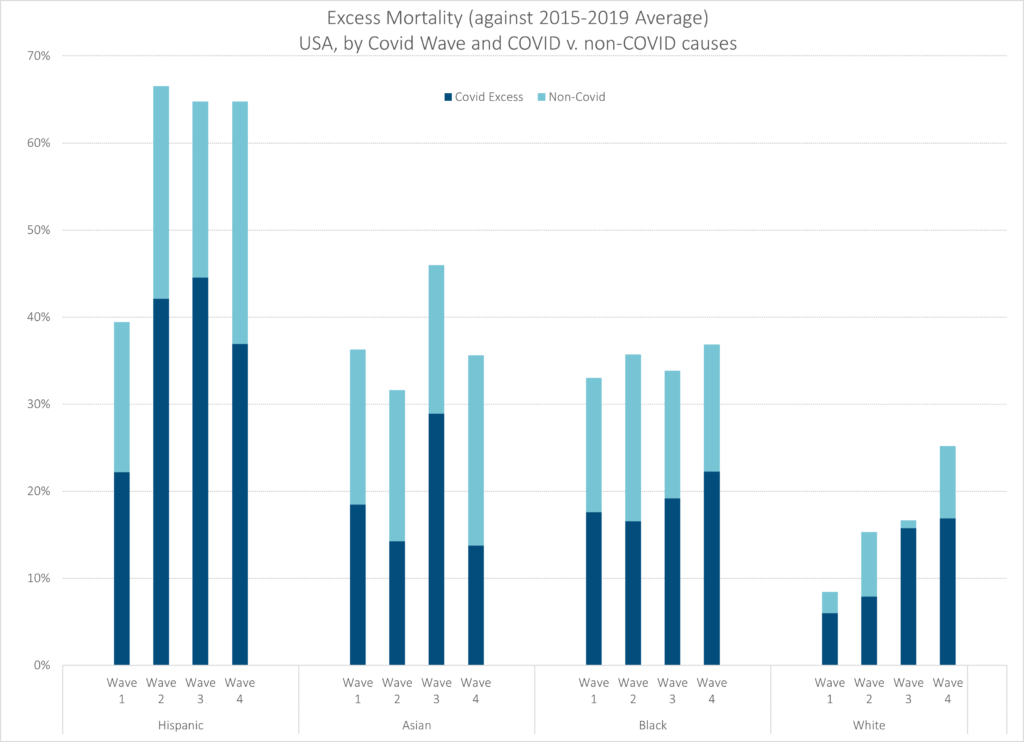
As noted earlier, the Hispanic excess mortality was about a level as the other non-White groups, but then spiked with Wave 2 and stayed very high.
The Asian group saw its excess mortality peak with Wave 3 — remember, that’s the large wave with the most COVID deaths. But they have been at about 30 – 35% excess mortality for the other waves.
The Black group looks like it’s slightly rising in excess mortality, but staying within a fairly narrow range of about 33% to 37% excess mortality.
The White group is definitely showing an increasing trend of excess mortality. Interesting.
Due to the White group’s increasing excess mortality, the overall population is showing an increasing trend — look, Whites have been the majority of deaths for a long time, as they’re the majority of old folks. That’s how that works.
About ten years ago, when the replication crisis started, we learned a certain set of tools for examining studies.
Check for selection bias. Distrust “adjusting for confounders”. Check for p-hacking and forking paths. Make teams preregister their analyses. Do forest plots to find publication bias. Stop accepting p-values of 0.049. Wait for replications. Trust reviews and meta-analyses, instead of individual small studies.
These were good tools. Having them was infinitely better than not having them. But even in 2014, I was writing about how many bad studies seemed to slip through the cracks even when we pushed this toolbox to its limits. We needed new tools.
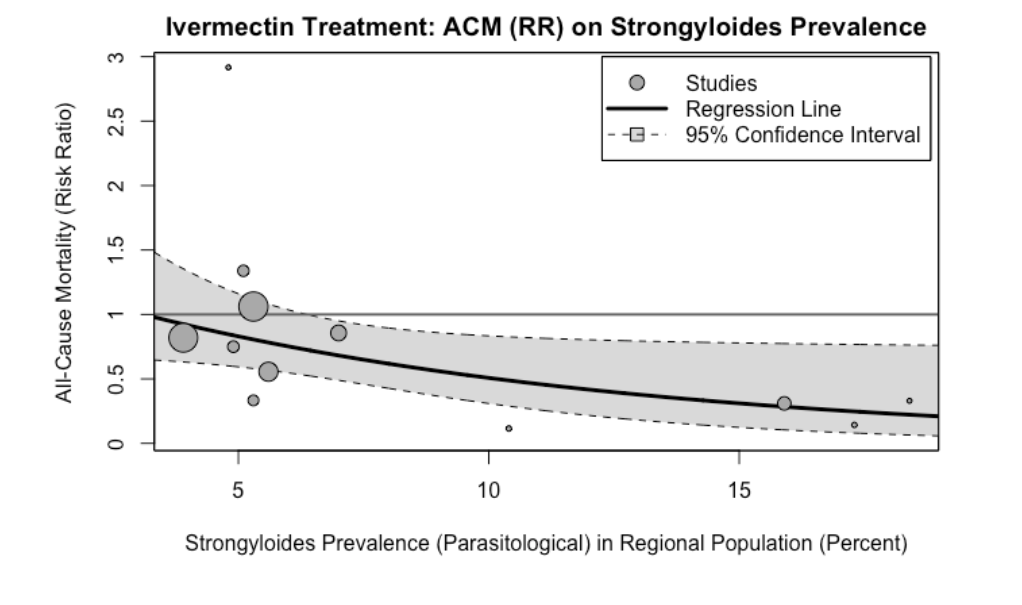
I think the methods that Meyerowitz-Katz, Sheldrake, Heathers, Brown, Lawrence and others brought to the limelight this year are some of the new tools we were waiting for.
Part of this new toolset is to check for fraud. About 10 – 15% of the seemingly-good studies on ivermectin ended up extremely suspicious for fraud. Elgazzar, Carvallo, Niaee, Cadegiani, Samaha. There are ways to check for this even when you don’t have the raw data. Like:
The Carlisle-Stouffer-Fisher method: Check some large group of comparisons, usually the Table 1 of an RCT where they compare the demographic characteristics of the control and experimental groups, for reasonable p-values. Real data will have p-values all over the map; one in every ten comparisons will have a p-value of 0.1 or less. Fakers seem bad at this and usually give everything a nice safe p-value like 0.8 or 0.9.
GRIM – make sure means are possible given the number of numbers involved. For example, if a paper reports analyzing 10 patients and finding that 27% of them recovered, something has gone wrong. One possible thing that could have gone wrong is that the data are made up. Another possible thing is that they’re not giving the full story about how many patients dropped out when. But something is wrong.
But having the raw data is much better, and lets you notice if, for example, there are just ten patients who have been copy-pasted over and over again to make a hundred patients. Or if the distribution of values in a certain variable is unrealistic, like the Ariely study where cars drove a number of miles that was perfectly evenly distributed from 0 to 50,000 and then never above 50,000.
Green bonds. Issuance is expected to hit a record high this year and so are municipal green bond offerings. My friend and colleague Mark Funkhouser explains why local leaders should take advantage of this alignment of financial interests and moral ones.
More spending flexibility in the American Rescue Plan. Legislation now making its way through Congress would allow governments to use some of their ARP funds for highway and transit projects and to address natural disasters.
Rising income tax revenue. The K-shaped recovery and federal stimulus has resulted in the largest median state personal income jump in 14 years. According to Fitch Ratings, state income tax revenues increased by 6.3% last year and this year is expected to produce similar growth. This has implications for public pensions, tax cuts and — of course — the 2022 midterms.
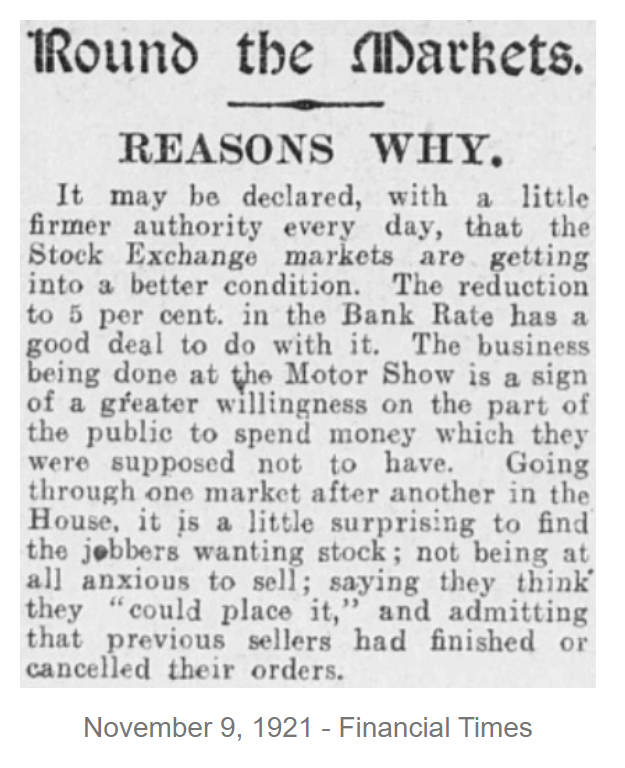
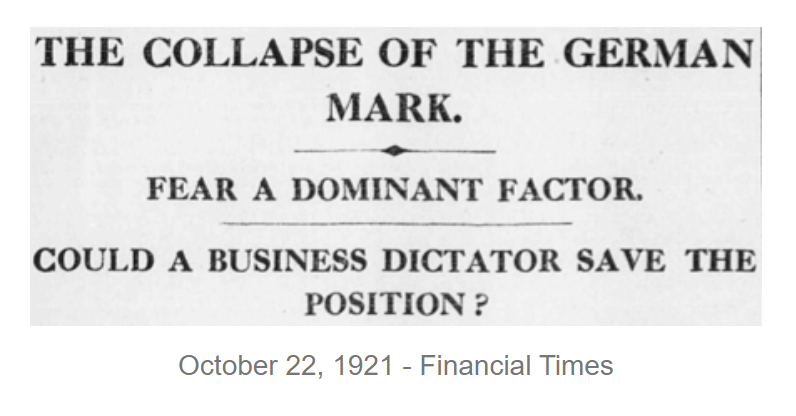
Companies ranging from Ford Motor Company to Union Pacific Railroad report substantially improved business activity for the month of October. The current recession may have ended in the summer. Aggregate bond purchases were the largest since one year ago as Americans finally start investing again. Opinion articles, however, advise against common stock and its gambling attributes.
Historical Fact: American and international investors will soon assume high GDP growth is a feature of the American economy, as God-given and laid down in the natural order as the seasons. At the end of 1921, however, it’s not yet clear elements are present for business revival.
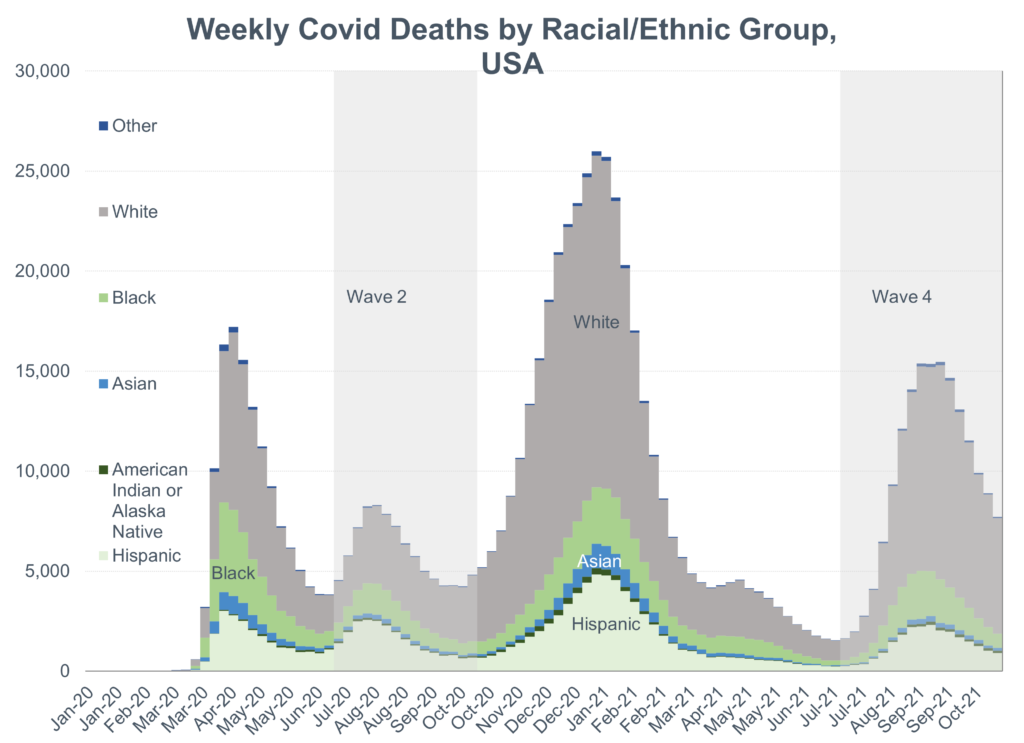
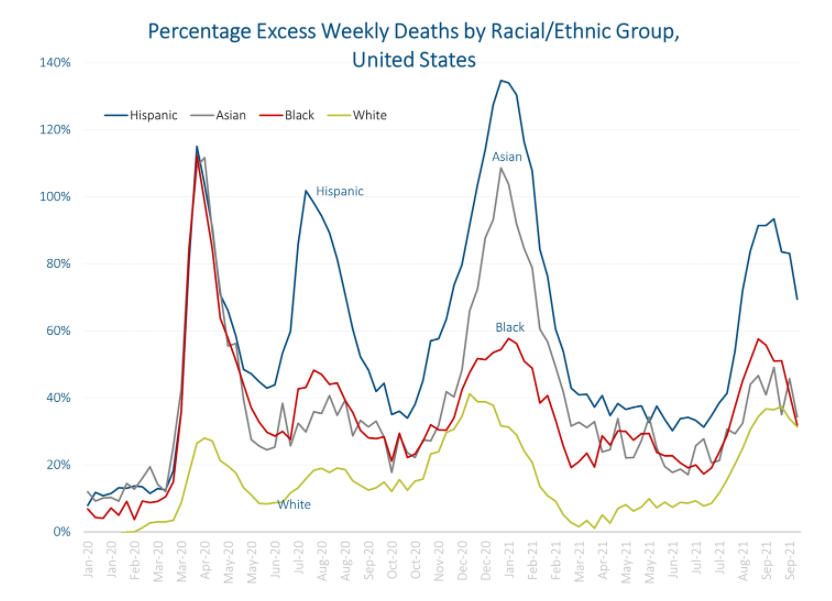
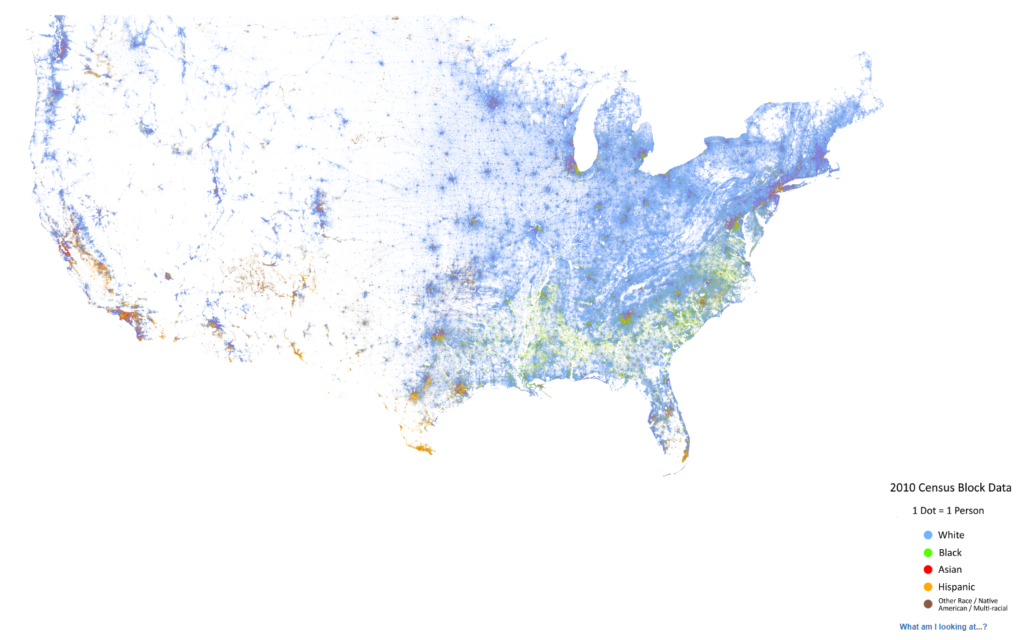
And now you can see it — the blue curve for Hispanics has a summer 2020 peak much higher than that for whites, Blacks, and Asians.
I want to note the high peak for Asian deaths in winter 2020-2021.
See that there is a high spike for Asian, Hispanic, and Black in that first NYC-centered wave that we’ve known so well… but a little blip for White. And I want you to think about that a little. Because that really explains a lot of the disproportionate effects on minorities in the U.S. and it goes back to Charles Blow’s question at the top of this post.
The answer to all of this being geographic distribution.
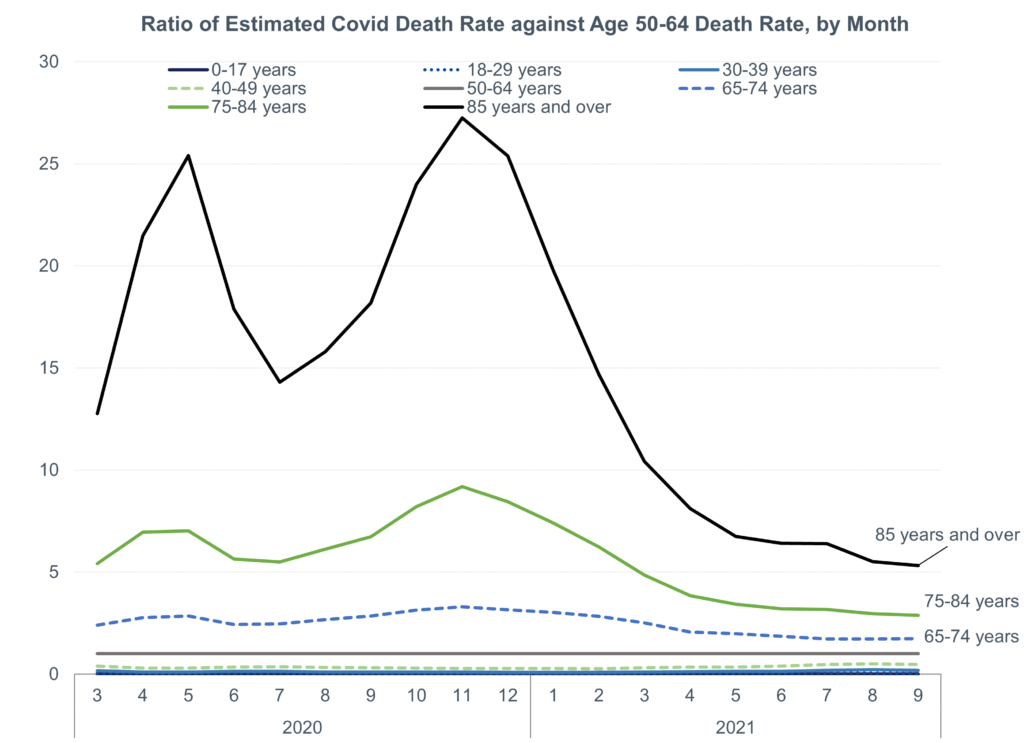
I will put a few facts in front of you, and you think it through: – The population age 85+ in the U.S. in 2020 was 6.3 million – Through July 2021, there were a little over 180K COVID deaths for that group – That’s about 3% of the age 85+ population
Do you think only 3% of the age 85+ population is vulnerable to COVID?
Pretty much all of them are “vulnerable”. The mortality rate for people age 85 (much less older) was 7.3% for females and 9.5% for males in the most recently available tables. It only goes up from there.
There is a huge difference in mortality by age for just non-pandemic years, and it’s also true for COVID.
There may be a few hardy souls with a base risk similar to the middle-aged without vaccines, but the percentage is not high.
The vaccines have been having an effect in cutting risk.
The prominent German industrialist Hugo Stinnes suggests a fringe dictatorship might seize power because the poorly drawn up armistice extracts too great a toll on the Teutonic nation. He reckons that one of the infant right wing parties could take power some day. Whatever the case, trouble is brewing.
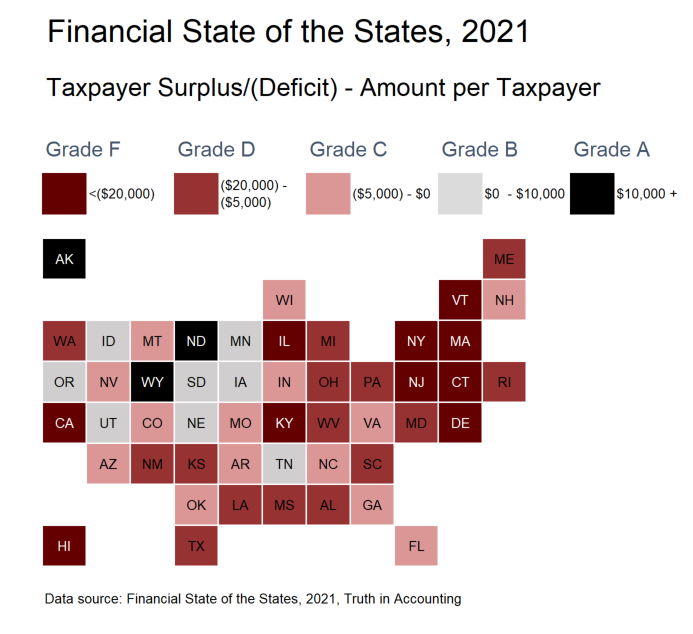
One large benefit of a tile grid map is you can see the geographically small states, which are often more obscured when you a geographically accurate map.
When viewed in this way, with the states colored by their grades, you can see that there’s a Northeastern Rogue’s Gallery, in addition to the expected stinkers of Illinois, Kentucky, and California (also, Hawaii, but many people don’t expect that one.)
But I want to point out that a lot of “red” states, in the political sense, also have crappy finances.
Texas is a particularly bad offender here, with a taxpayer deficit of -$13,100 per taxpayer. It’s not just the “expected” states where pensions are grossly underfunded — mind you, pretty much every single taxpayer sinkhole here has grossly underfunded state-level pensions — but it is a widespread problem.