Link: https://erictopol.substack.com/p/the-amazing-power-of-machine-eyes
Graphic:
Excerpt:
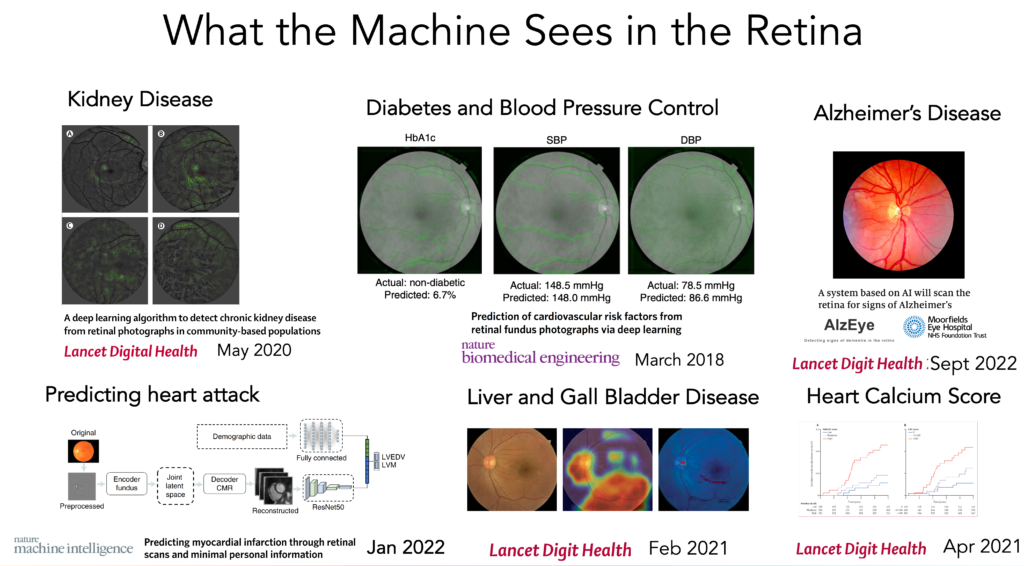
Today’s report on AI of retinal vessel images to help predict the risk of heart attack and stroke, from over 65,000 UK Biobank participants, reinforces a growing body of evidence that deep neural networks can be trained to “interpret” medical images far beyond what was anticipated. Add that finding to last week’s multinational study of deep learning of retinal photos to detect Alzheimer’s disease with good accuracy. In this post I am going to briefly review what has already been gleaned from 2 classic medical images—the retina and the electrocardiogram (ECG)—as representative for the exciting capability of machine vision to “see” well beyond human limits. Obviously, machines aren’t really seeing or interpreting and don’t have eyes in the human sense, but they sure can be trained from hundreds of thousand (or millions) of images to come up with outputs that are extraordinary. I hope when you’ve read this you’ll agree this is a particularly striking advance, which has not yet been actualized in medical practice, but has enormous potential.
Author(s): Eric Topol
Publication Date: 4 Oct 2022
Publication Site: Eric Topol’s substack, Ground Truths