5 Worst States for Working-Age Deaths in August

Link: https://www.thinkadvisor.com/2022/09/27/5-worst-states-for-working-age-deaths-in-august/

Graphic:

Excerpt:

The number of deaths of working-age Americans was lower in August than in August 2021, but it was still much higher than it was in August 2019, before the COVID-19 pandemic began.

Death figures for the period from July 31 through Aug. 27 are just starting to firm up. But very early figures show that at least 53,655 U.S. residents ages 25 through 64 died from COVID-19 and all other causes during that four-week period.

The number of deaths was down sharply from 77,847 in August 2021, but it was still up 6.1% from the total of 50,590 for August 2019.

Author(s): Allison Bell

Publication Date: 27 Sept 2022

Publication Site: Think Advisor
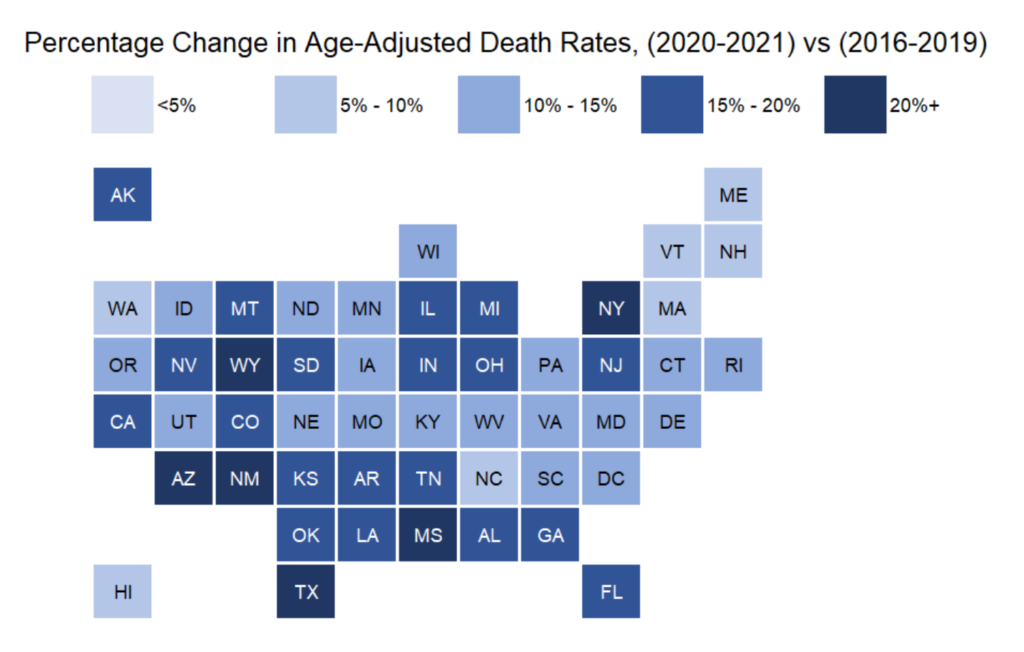
Geography of Mortality: State Ranking by Increase in Total Mortality and COVID Mortality, 2020-2021, Provisional

Link: https://marypatcampbell.substack.com/p/geography-of-mortality-state-ranking

Graphic:

Video:

Excerpt:

With this tile grid map, we can see that the two-year mortality experience has been horrible, even on an age-adjusted basis. I will be using age-adjusted death rates [using the standard 2000-reference-age-adjustment] for all the comparisons. The methodology is at the end of the post.

I warn against taking any meaning from North Carolina, as it has a data-reporting problem. Hawaii, however, really does have a low increase in mortality, and I believe it is credible that the mortality increase of the northeast is also low. I am not sure how credibly to take the increase in mortality of Wyoming, given its relatively small population.

However, we can see some patterns. In general, one has a “hot spot”, and then the increase falls off as you retreat from that peak. The large pattern is the high increase along the southern border — Arizona, New Mexico, Texas, Mississippi — and then the next layer above is less bad, and so forth. There is the Wyoming peak, falls off around there. There is the midwest cluster – Illinois, Michigan, Indiana, Ohio. And then New York/New Jersey.

As well we know, the excess mortality is driven primarily by COVID, which I will get to in the next major section, but let me share some ranking tables.

Author(s): Mary Pat Campbell

Publication Date: 23 Feb 2022

Publication Site: STUMP at substack

Up For Grabs: The Best & Worst States For Business 2021

Graphic:

Excerpt:

For the 17th year in a row, Texas tops Chief Executive’s Best and Worst States for Business list. Number two? Florida, once again. When it comes to the three criteria CEOs tell us they value most in site selection—tax policy (37 percent rank it first), regulatory climate (35 percent) and talent availability (25 percent)—Texas and Florida outclass all comers. (Find out why, despite the February storm and power collapse, businesses are still flocking to the Lone Star State.)

And once again—yawn—California, New York, Illinois and Massachusetts pile up at the bottom of our rankings (based entirely on polling of the nation’s CEOs) where they have dwelt for most of the list’s existence.

But while the names at the top and the bottom remain unchanged, what has changed— dramatically—are the stakes. Governors take note: Our survey—of 383 CEOs in March 2021— finds the nation’s business leaders an increasingly restless bunch thanks to Covid. They’re open to all kinds of new ideas about how—and, more to the point—where to do business.

Publication Date: 28 April 2021

Publication Site: Chief Executive