The Society of Actuaries Announces ASA Curriculum Changes, Micro-Credentials and Affiliate Membership

Press release: https://www.soa.org/resources/announcements/press-releases/2021/2021-asa-changes-member/

FAQ: https://www.soa.org/education/general-info/asa-micro-credentials/

Pathway comparison, more info: https://www.soa.org/globalassets/assets/files/edu/asa-pathway-changes.pdf

Graphic:
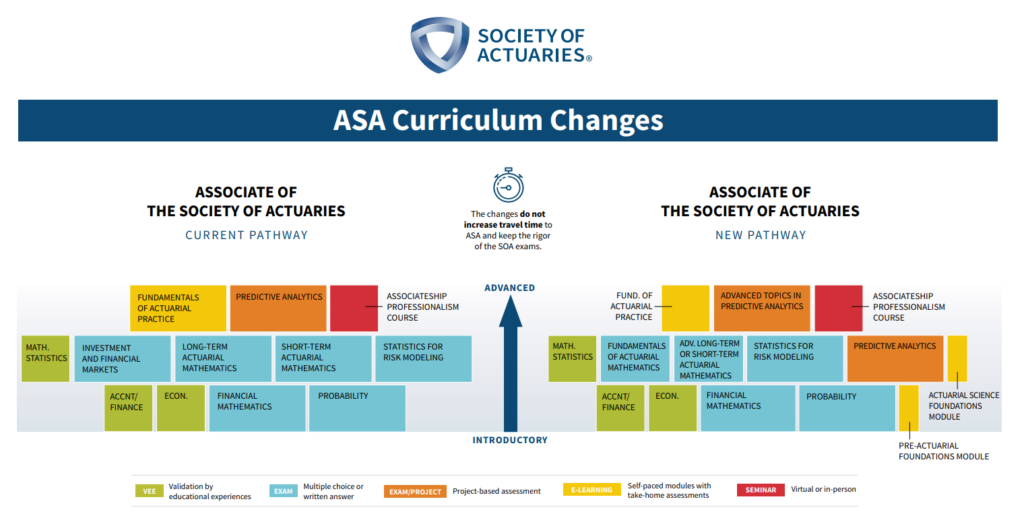
Excerpt:

Beginning in January 2022, pre-ASA candidates will also be able to begin work to earn new micro-credentials that recognize and demonstrate to employers their knowledge and skills gained along the pathway to ASA. These “milestone markers” will remain with candidates if they decide to leave the ASA pathway and are also applicable for those choosing to enter the pathway to only earn one or more micro-credential. All elements required to earn these micro-credentials are part of the ASA pathway and count in full toward earning the ASA and FSA designations.

These micro-credentials group together pathway components that represent distinct knowledge and skills to demonstrate the level of achievement candidates earn to employers, co-workers and their professional network. AQ/EQ and data science skills are driving changes to the ASA curriculum and will be incorporated into requirements for each micro-credential, allowing candidates the ability to demonstrate and build on those skills for their resume and jobs.

These micro-credentials do not make candidates qualified or “signing” actuaries; that work is reserved for those who earn the ASA and FSA designations. However, they do provide critical marks of candidates’ progress through the system and signal to employers the knowledge they’ve gained. We will be conducting an outreach program to employers to build awareness and support for the micro-credentials over the coming months.

Author(s): SOA

Publication Date: 12 July 2021

Publication Site: Society of Actuaries

Have Fun With Approximations!

Link: https://www.linkedin.com/pulse/have-fun-approximations-mary-pat-campbell/

Graphic:

Pdf: https://drive.google.com/file/d/0ByabEDuWaN6FNmZhTDBYeEVrNVE/view?resourcekey=0-U4GI2_9zn4UQdWza1bq95w

Excerpt:

In the pre-computer days, people used these approximations due to having to do all calculations by hand or with the help of tables. Of course, many approximations are done by computers themselves — the way computers calculate functions such as sine() and exp() involves approaches like Taylor series expansions.

The specific approximation techniques I try (1 “exact” and 6 different approximation… including the final ones where I put approximations within approximations just because I can) are not important. But the concept that you should know how to try out and test approximation approaches in case you need them is important for those doing numerical computing.

Author(s): Mary Pat Campbell

Publication Date: 3 February 2016 (updated for links 2021)

Publication Site: LinkedIn, CompAct, Society of Actuaries

Several Ways to Improve Your Use of Excel for Actuarial Production

Link: https://www.soa.org/sections/small-insurance/small-insurance-newsletter/2021/june/stn-2021-06-mathys/

Graphic:

Excerpt:

Create a Consistent Structure for Calculations

When spreadsheets are created ad-hoc, the usage of time steps tends to be inconsistent: advancing by rows in one sheet, columns in another, and even a mix of the two in the same sheet. Sometimes steps will be weeks, other times months, quarters, or years. This is confusing for users and reviewers, leads to low trust, increases the time for updates and audits, and adds to the risks of the spreadsheet.

A better way is to make all calculations follow a consistent layout, either across rows or columns, and use that layout for all calculations, regardless if it requires a few more rows or columns. For example, one way to make calculations consistent is with time steps going across the columns and each individual calculation going down the rows:

Author(s): Stephan Mathys

Publication Date: June 2021

Publication Site: Small Talk at the Society of Actuaries

Impact of COVID-19 on Actuarial Careers: Highlights Report

Link: https://www.soa.org/resources/research-reports/2021/covid-19-highlights/

Report link: https://www.soa.org/globalassets/assets/files/resources/research-report/2021/covid-19-highlights.pdf

Graphic:

Excerpt:

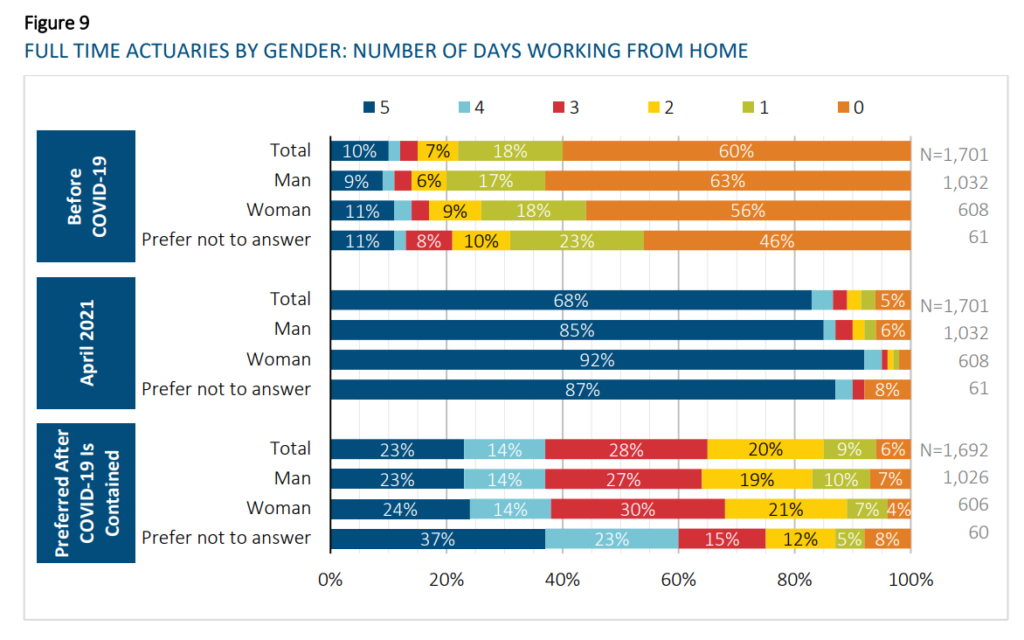
Working from home was a significant change for most actuaries. While some are looking forward to
returning to work in the office, few would like to return to working in the office most or all of the time.
After COVID-19 restrictions are fully lifted, approximately 65% of full-time respondents would prefer to
work from home at least 3 days per week: 28% would prefer to work from home three days per week, 23%
would like to work from home every day, and 14% would prefer to work from home 4 days per week.

In general, respondents who identify as women have a slight preference to work from home more
frequently than do respondents who identify as men.

Author(s): SOA

Publication Date: June 2021

Publication Site: Society of Actuaries

SOA Member Town Hall on University-Earned Credit

Video description:

SOA leadership and members discuss the University-Earned Credit (UEC) program. Watch this recording of the May 24 member town hall about UEC. If you have any additional questions email us at membercomms@soa.org. Learn about the UEC program by visiting https://www.soa.org/education/resources/uec/uec-program/

Access the FAQs at www.soa.org/education/resources/uec/uec-faq/

Publication Date: 27 May 2021

Publication Site: Society of Actuaries on YouTube
Mortality with Meep – U.S. Mortality Preliminary 2020 Experience

Description:

Reviewing the recent Society of Actuaries report on preliminary mortality results in U.S. population, with a focus on increased mortality from non-COVID causes. U.S. Population Mortality

Observations, Preview of 2020 Experience Society of Actuaries research:

https://www.soa.org/resources/research-reports/2021/us-population-observations-preview/

https://www.soa.org/globalassets/assets/files/resources/research-report/2021/us-population-observations-preview.pdf

Author(s): Mary Pat Campbell

Publication Date: 21 May 2021

Publication Site: Meep’s Math Matters on YouTube

U.S. Population Mortality Observations Preview of 2020 Experience

Report Link: https://www.soa.org/globalassets/assets/files/resources/research-report/2021/us-population-observations-preview.pdf

Link: https://www.soa.org/resources/research-reports/2021/us-population-observations-preview/

Graphic:

Excerpt:

The overall age-adjusted mortality rate for 2020 was 828.7 deaths per 100,000 of population. This rate was 15.9% greater than the 2019 overall age-adjusted mortality rate. This high level of mortality has not been experienced in the U.S. since 2003.

If deaths coded as COVID (COVID deaths)3 were excluded, the overall age-adjusted 2020 mortality rate would have been 737.2 per 100,000 or 3.1% higher than the 2019 rate. This increase excluding COVID deaths is also noteworthy because it reverses the two previous calendar years of decreasing mortality; however, some or all of this may be due to the misclassification of CODs as discussed in Section 6.

2020 mortality rates increased in both sexes, with the male rates increasing more than the female rates. The differences in the increases between males and females were about 3% when all causes of death (CODs) are included and about 1% when COVID deaths are excluded.

The slope of the 2020 COVID mortality curve by age group is not as steep as the slope of the non-COVID deaths, indicating that COVID impacts younger ages more evenly across age groups that all other non-COVID CODs combined.

In the review of the 2020 mortality rates by age group, it is interesting to see that the highest percentage increases were in the younger adult ages, not at the very old ages. When COVID deaths were removed, ages 15-44 saw the largest increases in mortality rates.

Author(s): Cynthia MacDonald, FSA, MAAA

Publication Date: 20 May 2021

Publication Site: Society of Actuaries
Keep Up With the Standards: On ASOP 56, Modeling

Link: https://www.soa.org/sections/modeling/modeling-newsletter/2021/april/mp-2021-04-campbell/

Excerpt:


If nothing else, having a checklist to go through while working on modeling can help you make sure you don’t miss anything. Hey, ASB, make some handy-dandy sticky note checklists we can stick on our monitors to ask us:

3.1 Does our model meet the intended purpose?

3.2 Do we understand the model, especially any weaknesses and limitations?

3.3 Are we relying on data or other information supplied by others?

3.4 Are we relying on models developed by others?

3.5 Are we relying on experts in the development of the model?

3.6 Have we evaluated and mitigated model risk?

3.7 Have we appropriately documented the model?

Author(s): Mary Pat Campbell

Publication Date: April 2021

Publication Site: The Modeling Platform at the Society of Actuaries

Actuaries Find Race and Ethnicity Disclosure Gap

Link: https://www.thinkadvisor.com/2021/04/06/actuaries-find-race-and-ethnicity-disclosure-gap/

Excerpt:

About 12% of U.S. residents are Black, and 15% are Hispanic or Latino.

In the insurance industry, 12% of employees are Black and 12% are Hispanic or Latino.

Just 4.4% of new SOA members are Black, and 3.7% of new members are Hispanic or Latino.

Author(s): Allison Bell

Publication Date: 6 April 2021

Publication Site: Think Advisor

Rational Ignorance and the Protection Gap: Is There a Cure?

Link: https://www.soa.org/sections/reinsurance/reinsurance-newsletter/2021/march/rsn-2021-03-poon-affat/

Excerpt:

The phrase “coverage gap,” heard often from life insurance company executives, is defined as  “the shortfall in the amount of life insurance cover necessary to maintain the current living standards of dependents.” Life insurance companies devote extraordinary amounts of time, effort, and expense trying to educate underinsured individuals about the need to protect themselves and their families from this gap by buying more cover. Could our industry not be addressing one of the key issues leading to the lack of consumer enthusiasm for our products?

Here’s the issue: insurance products and contracts are not consumer-friendly. To the average person, life and living benefits products are at least as byzantine as Brazil’s political system, and the language of insurance contracts could almost be considered an actual dialect. Insurance is thus fertile ground for the manifestation of rational ignorance among potential customers, who are already known to be more likely to pay attention to information about it if it comes from friends and social media posts. (I pity the buyer researching concepts and options such as pure protection, accumulation, critical illness, disability income, or long-term care.)

Author(s): Ronald Poon-Affat

Publication Date: March 2021

Publication Site: Reinsurance News at the Society of Actuaries

Who Gets to Live to 100 and Who Doesn’t? Reviewing the 2020 Living to 100 Symposium Monograph

Link: https://www.soa.org/sections/reinsurance/reinsurance-newsletter/2021/march/rsn-2021-03-kaufhold/

Excerpt:

Given these advances in understanding the theoretical methods of evaluating multiple, related mortality data sets, it is particularly promising that the Human Mortality Database, with the SOA’s sponsorship, has recently made available mortality data for the United States at the level of the individual county. Moreover, Professor Magali Barbieri of University of California, Berkeley in January 2021 published an SOA Research Report[3] on “Mortality by Socio-economic Category in the United States” using this data series. Professor Barbieri is one of the directors of the HMD project, which is jointly run by UC Berkeley and the Max Planck Institute for Demographic Research in Rostock, Germany and support from the Center on the Economics and Development of Aging (CEDA) and the French Institute for Demographic Studies (INED). In her paper, Barbieri studies socio-economic differences linked to mortality differentials by county, based on information available at the county level regarding education, occupation, employment, income, and housing. The gap between the highest and lowest county decile is huge and growing. In 2018, the qx-rate for 45-year-old men in counties with the lowest Socioeconomic Index Score (SIS) was 2.5 times that for men of that age in counties with the highest SIS. This gap is even greater than the difference between smokers and non-smokers. Professor Barbieri’s report shows the widening trend between the different socio-economic strata which she captures by grouping the counties into deciles by SIS. While the highest SIS score is associated with a life expectancy that matches or even beats the OECD average, people living in counties with the lowest SIS have hardly seen any improvement in their life expectancy over the last four decades. Comparing the average life expectancy at birth within the highest decile of counties to the lowest, there was a gap of 3.0 years in 1982, the first year for which consistent data was available. This gap has more than doubled since then, rolling in at 6.6 years difference in life expectancy in 2018. That is an increase of 120 percent. Worse still, the gender gap once again manifests itself in the mortality trends, with females showing an increase of the socio-economic mortality gap of 260 percent over the 36-year period, compared to 76 percent for males.

Author(s): Kai Kaufhold

Publication Date: March 2021

Publication Site: Reinsurance News at the Society of Actuaries