Volunteer With SOA Education

Link: https://theactuarymagazine.org/volunteer-with-soa-education/

Excerpt:

As you begin (or consider) volunteering with Society of Actuaries (SOA) Education, you may have questions. As a long-time SOA Education volunteer and past general chairperson of SOA Education, perhaps I have answers that will help.

My volunteer journey began in 1993. I had just obtained my FSA when I got a call from SOA volunteer Bruno Gagnon, FCIA, asking if I wanted to get involved in SOA Education. It’s been an incredible journey of learning, support and networking since. I hope your volunteer journey is just as rewarding.

……

WHAT BENEFITS DOES VOLUNTEERING BRING?
The most interesting aspects of this endeavor are of a different nature. For example, the first privilege was to work with subject-matter experts who were highly regarded and respected in the industry and learn from them. This could be from a technical and leadership point of view. It was rewarding to see a group of volunteers with similar interests working together efficiently while having fun. The members had specific roles and would not hesitate to help their colleagues when needed. Over the years, SOA Education volunteers have shown they can adapt to change quickly. The adjustments that were put in place during the pandemic are a great example.

A member volunteer can gain experience and look for opportunities to grow in their role and take on different responsibilities. The possibilities are diverse, allowing a member to become an expert in their role or a leader within the exam team, depending on their interests, skills and circumstances.

Having participated in all the possible levels within the SOA Education volunteer structure, I honestly can say the experience has been challenging at times—but always highly rewarding. I would relive the journey at any time, as I made very dear friends along the way.

Author(s): STELLA-ANN MÉNARD

Publication Date: Sept 2022

Publication Site: The Actuary, SOA

Social and Other Determinants of Life Insurance Demand

Link: https://www.soa.org/resources/research-reports/2022/determinants-life-insurance/

Report: https://www.soa.org/4a50aa/globalassets/assets/files/resources/research-report/2022/determinants-life-insurance.pdf

Graphic:

Excerpt:

The authors examine 19 factors to determine which were most closely linked to permanent and term life insurance premiums sold in the United States in 2020. With spatial regression analysis using multi-scale geographically weighted regression (MGWR) approach, the authors find the following 5 covariates to be the most statistically significant for and positively correlated with permanent insurance sold: household income, percentage of the population that is African American, education, health insurance, and Gini index (a statistical measure of wealth inequality). For term insurance sold, the 5 most significant covariates are household income, education, Gini index, percentage of households with no vehicles, and health insurance. Their relationships with term insurance sold are positive except for the percentage of households with no vehicles.

Author(s):

Wilmer Martinez
Kyran Cupido
Petar Jevtic
Jianxi Su

Publication Date: August 2022

Publication Site: SOA

Coordinating VM-31 With ASOP No. 56 Modeling

Link: https://www.soa.org/sections/financial-reporting/financial-reporting-newsletter/2022/july/fr-2022-07-rudolph/

Excerpt:

In the PBRAR, VM-31 3.D.2.e.(iv) requires the actuary to discuss “which risks, if any, are not included in the model” and 3.D.2.e.(v) requires a discussion of “any limitations of the model that could materially impact the NPR [net premium reserve], DR [deterministic reserve] or SR [stochastic reserve].” ASOP No. 56 Section 3.2 states that, when expressing an opinion on or communicating results of the model, the actuary should understand: (a) important aspects of the model being used, including its basic operations, dependencies, and sensitivities; (b) known weaknesses in assumptions used as input and known weaknesses in methods or other known limitations of the model that have material implications; and (c) limitations of data or information, time constraints, or other practical considerations that could materially impact the model’s ability to meet its intended purpose.

Together, both VM-31 and ASOP No. 56 require the actuary (i.e., any actuary working with or responsible for the model and its output) to not only know and understand but communicate these limitations to stakeholders. An example of this may be reinsurance modeling. A common technique in modeling the many treaties of yearly renewable term (YRT) reinsurance of a given cohort of policies is to use a simplification, where YRT premium rates are blended according to a weighted average of net amounts at risk. That is to say, the treaties are not modeled seriatim but as an aggregate or blended treaty applicable to amounts in excess of retention. This approach assumes each third-party reinsurer is as solvent as the next. The actuary must ask, “Is there a risk that is ignored by the model because of the approach to modeling YRT reinsurance?” and “Does this simplification present a limitation that could materially impact the net premium reserve, deterministic reserve or stochastic reserve?”

Understanding limitations of a model requires understanding the end-to-end process that moves from data and assumptions to results and analysis. The extract-transform-load (ETL) process actually fits well with the ASOP No. 56 definition of a model, which is: “A model consists of three components: an information input component, which delivers data and assumptions to the model; a processing component, which transforms input into output; and a results component, which translates the output into useful business information.” Many actuaries work with models on a daily basis, yet it helps to revisit this important definition. Many would not recognize the routine step of accessing the policy level data necessary to create an in-force file as part of the model itself. The actuary should ask, “Are there risks introduced by the frontend or backend processing in the ETL routine?” and “What mitigations has the company established over time to address these risks?”

Author(s): Karen K. Rudolph

Publication Date: July 2022

Publication Site: SOA Financial Reporter

Covid-19 Impact on the South African Life Insurance Industry: What Can we Learn?

Link: https://www.soa.org/sections/international/international-newsletter/2022/july/isn-2022-07-hoberg/

Graphic:

Excerpt:

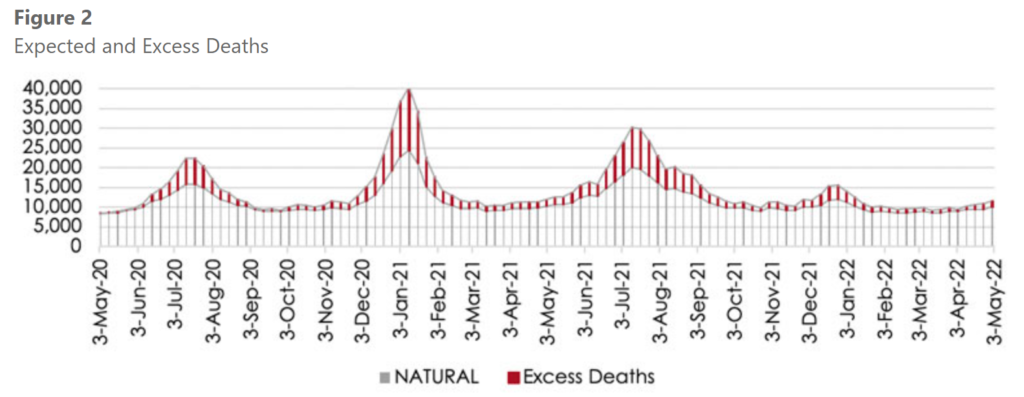
The impact of Covid-19 in South Africa in terms of excess deaths was substantial, when considering the reported excess deaths as published by the South African Medical Research Council (SAMRC).[4] Please note that in this article we will not further consider whether all excess deaths can be directly attributed to Covid-19, however, as per the article “Correlation of Excess Natural Deaths with Other Measures of the Covid-19 Pandemic in South Africa,”[5] it is estimated that 85 percent to 95 percent of excess natural deaths are attributable to Covid-19.

Based on the SAMRC excess deaths, taking the expected plus excess deaths as Actual and expected natural deaths as per their methodology as Expected, we observe an Actual versus Expected (AvE) ratio of 116 percent in 2020, a ratio of 131 percent in 2021, and a ratio of 113 percent in 2022 up to May 1. When we look at the AvE for each wave, we can see that the 2nd wave (predominantly Beta variant) and the 3rd wave (predominantly Delta variant), had the most severe impact on the general population (see figure 2 and figure 3)

Author(s): Idelia Hoberg

Publication Date: July 2022

Publication Site: SOA International News

Accelerated Death Benefit Rider Financing Approaches

Link: https://www.soa.org/sections/product-dev/product-dev-newsletter/2022/june/pm-2022-06-scholz-eaton/

Excerpt:

Living benefit riders to life insurance policies (also known as ‘combo’ or ‘hybrid’ policies) have become a core component of life insurance sales strategy. LIMRA reported that in 2020 “Combination products represented 24 percent of life insurance sales based on total premium.”[1] Concurrently, the long-term care insurance (LTCI) industry reached an inflection point when more LTCI (and chronic illness) benefits were sold through hybrid products than from standalone LTCI coverage.

On the spectrum of life and LTCI hybrid policies, the richest of these provide coverage of LTCI first through accelerating the policy’s death benefit, and then by providing extended LTCI benefits for many more years. There are a handful of individual and worksite insurers who sell these rich hybrid policies. On the other end of this spectrum are acceleration-only riders to life insurance policies. These riders provide policyholders the opportunity to receive a portion of the policy’s death benefit in advance, under certain conditions. Some of these riders do not cover qualified LTCI, but instead cover ‘chronic illness,’ which has a similar benefit trigger but is not formally LTCI.

This article outlines industry practice and consideration for pricing these acceleration-only policies. The National Association of Insurance Commissioners (NAIC) Model Regulation #620 addresses accelerated death benefit riders to life insurance policies.[2] Model Regulation #620 outlines three financing methods for accelerated death benefit riders which we describe in this article. The Interstate Insurance Product Regulation Commission (the IIPRC, or the “Compact”) adopted standards for some of these riders in the Additional Standards for Accelerated Death Benefits (IIPRC-L-08-LB-I-AD-3).[3] For companies filing chronic illness, critical illness, and terminal illness products in the Compact, these standards define—among other items—the form and actuarial submission requirements and benefit design options for accelerated death benefit riders. If a company is filing an acceleration rider for a qualified LTCI benefit, that product would be subject to the IIPRC individual LTC insurance standards.

Author(s): Stephanie Scholz and Robert Eaton

Publication Date: June 2022

Publication Site: Product Matters!, SOA

The Mortality Improvement Model, MIM-2021-v2

Link: https://www.soa.org/resources/research-reports/2021/mortality-improvement-model/

Graphic:

Excerpt:

Different mortality projection methodologies are utilized by actuaries across applications and practice areas. As a result, the SOA’s Longevity Advisory Group (“Advisory Group”) developed a single framework to serve as a consistent base for practitioners in projecting mortality improvement.  The Mortality Improvement Model, MIM-2021-v2, Tools and User Guides, compose the consistent approach and are defined below.

  1. A report describing MIM-2021-v2 which summarizes the evolution of MIM-2021-v2; provides an overview of MIM-2021-v2; presents considerations for applying mortality assumptions in the model; and outlines issues the Advisory Group is currently considering for future model enhancements.
  2. A status report of the items listed in Section V of Developing a Consistent Framework for Mortality Improvement. This report advises practitioners about subsequent research and analysis conducted by the Advisory Group regarding these items.
  3. An Excel-based tool, MIM-2021-v2 Application Tool, and user guide, MIM-2021-v2 Application Tool User Guide, for practitioners to construct sets of mortality improvement rates under this framework for specific applications.
  4. An Excel-based tool, MIM-2021-v2 Data Analysis Tool, and user guide, MIM-2021-v2 Data Analysis Tool User Guide, for practitioners to analyze the historical data sets included in the MIM-2021-v2 Application Tool.

The Longevity Advisory Group is planning to update the framework annually as new data and enhancements become available. MIM-2021-v2 is the first revision since the initial release in April 2021.  This version uses the same underpinning as the initial MIM-2021 release but has been refreshed to include another year of historical U.S. population mortality data as well as more user flexibility and functionality to replicate RPEC’s MP-2021 and O2-2021 scales.  

Author(s): Longevity Advisory Group

Publication Date: June 2022, most recent update

Publication Site: Society of Actuaries

ACTUARY VERSUS DATA SCIENCE

Link: https://www.oliverwyman.com/our-expertise/insights/2022/may/actuary-versus-data-science.html

Graphic:

Excerpt:

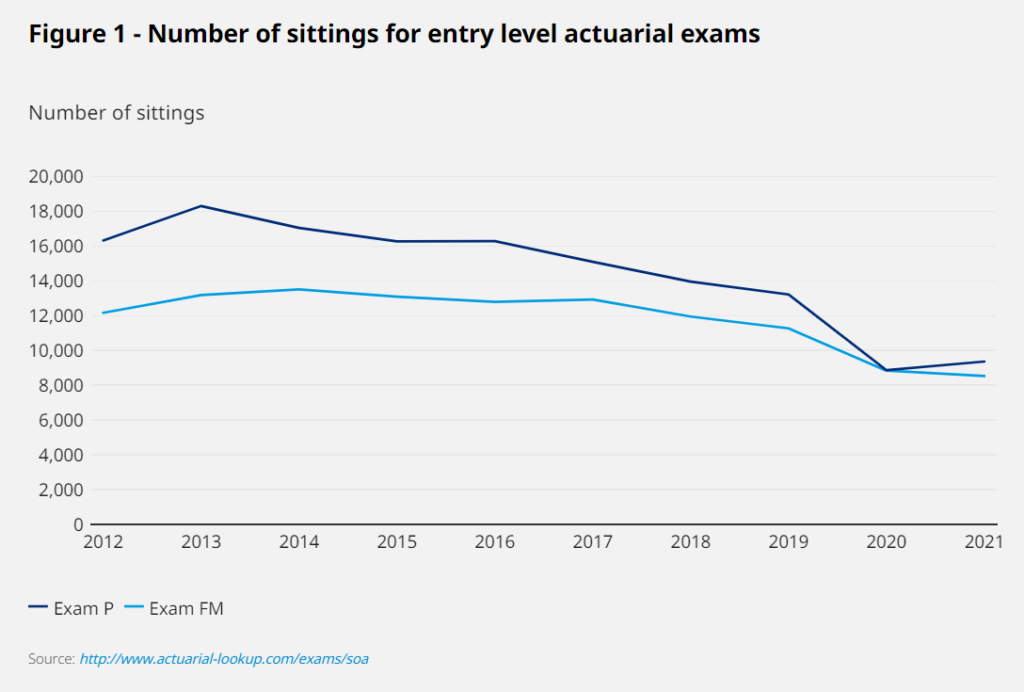
The number of candidates sitting for entry level exam P and exam FM decreased over the last decade. Figure 1 below shows the total attempts for Exams P and FM halving over the past decade.

This represents an average decline of 7% per year across the two exams. This shows a major change from 2013 when the Actuarial Profession was consistently ranked #1 in national job lists and the number of candidates sitting for exams was growing year over year. For reference, Actuary is currently ranked #20, behind software developer (#5) and data scientist (#6).

One hypothesis is that data scientists and similar job openings are drawing potential actuaries away from the profession. To investigate this question, we queried fifteen colleges, actuarial clubs, and their recent graduates to see if this trend was noticeable, with key learnings summarized below:

Candidates at schools with Society of Actuaries (SOA)’s Centers of Actuarial Excellence (CAE) recognition are more than twice as likely to remain on the actuarial career path. Further, the strongest programs appear to attract other majors due to the top-tier program and resources

Recently established data science majors are pulling some students away from actuarial science and quite a few interviewees perceived that the popularity of the actuarial science program is declining

For international students, there is a general perception that it is harder to get an actuarial job that provides working visa sponsorship, while most data science jobs still provide sponsorship

The mixed results between the first two findings suggest that the strongest college actuarial programs are becoming stronger while schools with fledgling or small programs may be struggling. For example, actuarial career fairs tend to be successful only after achieving a level of scale so that they are well attended by both prospective hires and recruiters.

Author(s): Eve Sun, Mark Spong, Roger Yuan

Publication Date: May 2022

Publication Site: Oliver Wyman

Decentralized Finance for Actuaries

Link: https://www.soa.org/resources/research-reports/2022/decentralized-finance/

Graphic:

Excerpt:

Decentralized finance, or DeFi, is an emerging financial system powered by blockchain technology. This research report aims to introduce actuaries to DeFi and help them develop a solid understanding of DeFi. It will begin with addressing “what is DeFi?” by providing an introduction on blockchains and DeFi. It will then discuss in further detail the key characteristics, applications, opportunities, and risks of DeFi. After providing the foundation, this report will discuss the potential adoption of DeFi and its interaction with the current financial system (sometime referred to as traditional finance for contrast with DeFi), and the implications for practicing and aspiring actuaries. In addition, a glossary of terms used in DeFi and a brief history of the development of DeFi have been included in the appendix.

Author(s):

Jen Houng (Erik) Lie, FSA, ZooFi Labs
Gwen Yun Weng, FSA, CFA, ZooFi Labs
Wai Chak Tse, ZooFi Labs

Publication Date: March 2022

Publication Site: SOA

COVID-19 Mortality Study: Analytics – 2021 Q2

Link: https://www.limra.com/en/research/benchmarks/u.s.-individual-life-insurance-covid-19-mortality-experience-study/analytics/2021-q2/

Graphic:

Excerpt:

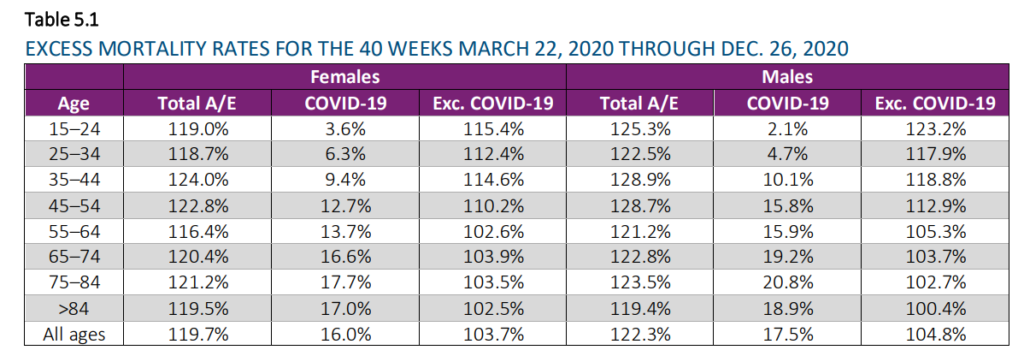
LIMRA, Reinsurance Group of America (RGA), the Society of Actuaries (SOA) Research Institute, and TAI have collaborated on an ongoing effort to analyze the impact of COVID-19 on the
individual life insurance industry’s mortality experience and share the emerging results with the insurance industry and the public. The Individual Life COVID-19 Project Work Group (Work
Group) was formed as a collaboration of LIMRA, RGA, the SOA Research Institute, and TAI to design, implement, and create the study and to produce and distribute a variety of analyses.
This report is the fifth public release from this collaboration and contains the results of the study of excess mortality for individual life insurance to include the second quarter of 2021.
Data from 31 companies representing approximately 72% of the industry face amount in force have been included in the analysis in this report. A total of 3.0 million death claims from
individual life policies from 2015 through June 30, 2021 make up the basis of the analysis.


Highlights for the 2nd Quarter

  • The second quarter of 2021 showed a significant realignment of the actual to expected relative mortality ratios, across many different cuts of the data.
  • It is worth noting that the third quarter 2021 results will likely not be as favorable due to the impact of the COVID-19 Delta variant whose impact first started in July 2021 and peaked
    around mid- September
  • All age groups improved in the second quarter compared to the first quarter of 2021, but the improvement was more dramatic in the older ages. While the three age groups shown under
    age 65 were still significantly over the trend established by 2015-2019, the age 65-84 group was within the 95% confidence bands and the age 85+ group was significantly better than the
    2015-2019 trend (p < 0.05).
  • Whereas the pandemic experience so far had showed substantial variations across different regions, this appears to have moderated during the 2nd quarter of 2022.

Author(s): Individual Life COVID-19 Project Work Group, SOA

Publication Date: May 2022, accessed 21 May 2022

Publication Site: LIMRA

U.S. Individual Life COVID-19 Reported Claims Analysis, Fourth Quarter, 2021 Update

Link: https://www.soa.org/resources/experience-studies/2022/us-ind-life-covid-q4/

PDF: https://www.soa.org/49ab0d/globalassets/assets/files/resources/research-report/2022/us-ind-life-covid-q4.pdf

Graphic:

Description:

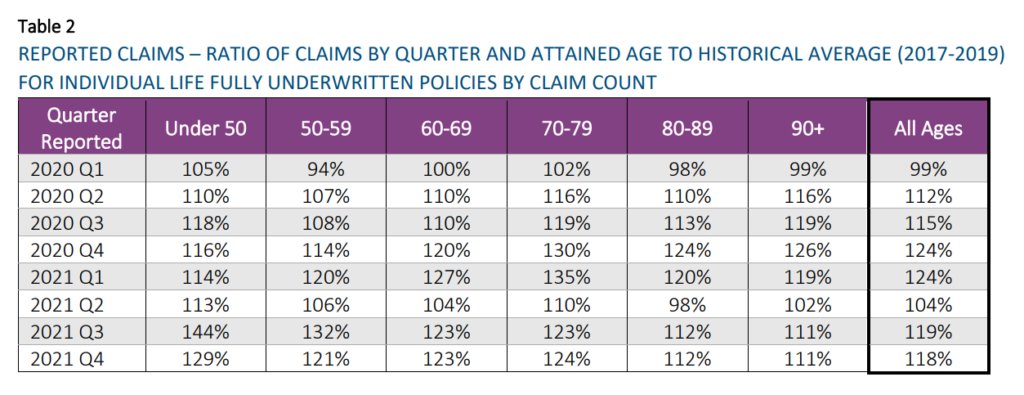
LIMRA, Reinsurance Group of America (RGA), the Society of Actuaries Research Institute (SOA), and TAI have collaborated on an ongoing effort to analyze the impact of COVID-19 on the individual life insurance industry’s mortality experience and share the emerging results with the insurance industry and the public. This report documents a high-level analysis of the claims that have been reported through December 31, 2021. The results presented here are based on data from 32 companies representing approximately 72% of the individual life insurance in force for the experience period of the study.

Author(s): Individual Life COVID-19 Project Work Group

Publication Date: May 2022, accessed 21 May 2022

Publication Site: Society of Actuaries

2022: A Great Opportunity for the Disability Insurance Market

Link: https://www.genre.com/knowledge/blog/2022-a-great-opportunity-for-the-disability-insurance-market-en.html

Graphic:

Excerpt:

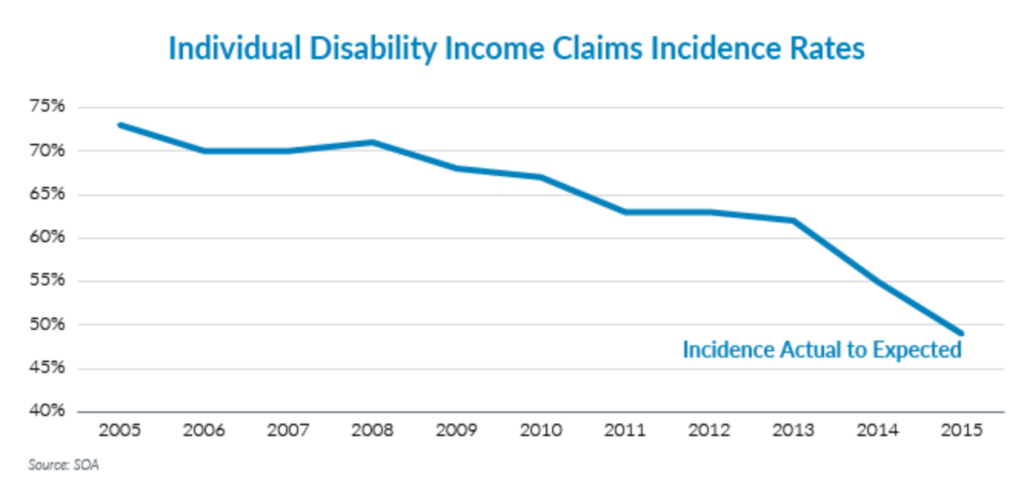
Second, one of the key drivers of these stable and low benefit ratios has been steady-to-declining rates of claims incidence. In a recent paper published by the SOA and co‑authored by Gen Re’s Jay Barriss, Individual Disability incidence rates were shown to have steadily improved over the 2005 to 2015 period, relative to the latest Individual Disability Valuation Table (IDIVT) incidence rate expectations.10 The favorable incidence rate trends have likely continued into at least into 2020 as Gen Re analysis on our reinsured blocks of disability business show continuing-to-stable incidence trends since 2015.

Author(s): Mike Krohn

Publication Date: 3 May 2022

Publication Site: Gen Re