Impact of AI on Mortality – Essay Collection

Link: https://www.soa.org/resources/research-reports/2024/ai-mortality-essay-collection/

PDF: https://www.soa.org/4a5e85/globalassets/assets/files/resources/research-report/2024/impact-ai-mortality/2024-impact-ai-mort-essays.pdf

Graphic:

Excerpt:

The Society of Actuaries (SOA) Research Institute’s Mortality and Longevity Strategic Research Program Steering Committee issued a call for essays to explore the application of artificial intelligence (AI) to mortality and longevity. The objective was to gather a variety of perspectives and experiences on the use of AI in mortality modeling, forecasting and prediction to promote discussion and future research around this topic.


The collection includes six essays that were accepted for publication from all submissions. Two essays were chosen for prizes based on their creativity, originality, and likelihood of further thought on the subject matter.

Author(s): multiple

Publication Date: September 2024

Publication Site: Society of Actuaries, SOA Research Institute

Group Life COVID-19 Mortality Survey – Updated through September 2021

Link: https://www.soa.org/resources/experience-studies/2022/group-life-covid-19-mortality/

Report PDF: https://www.soa.org/48ff80/globalassets/assets/files/resources/research-report/2022/group-life-covid-19-mortality.pdf

Graphic:

Excerpt:

Table 5.2 shows more detailed industry results for the top ten industry segments by number of COVID claims. Most of these industries were in the top ten for the July 2021 report as well. As we now have more quarters with more complete results, both the A/E ratios for April 2020 through September 2021, as well as the COVID claims as a percentage of baseline claims, showed greater consistency across industries than in the previous report. Public Administration continues to be a key driver of high A/E ratios for the White Collar category. Doctors (Healthcare, also White Collar), Retail Trade (Grey Collar), and Misc. Services (Grey Collar) have the highest COVID claims as a percentage of baseline claims. Heavy Steel Manufacturing (Blue Collar) has a much lower A/E ratio than the other top 10 industries. In the table below, “B,” “W,” and “G” refer to Blue Collar, White Collar, and Grey Collar, respectively.

It should be noted that the high A/E ratios for Public Administration are driven by experience in the Executive, Legislative, and General Government segment (Standard Industry Classification [SIC] codes 9100-9199). This segment does not include police and fire and represents over 85% of claims in the broader Public Administration segment.

Video:

Publication Date: January 2022

Publication Site: Society of Actuaries Research Institute

Data Challenges in Building a Facial Recognition Model and How to Mitigate Them

Link: https://www.soa.org/resources/research-reports/2023/data-facial-rec/

PDF: https://www.soa.org/49022b/globalassets/assets/files/resources/research-report/2023/dei107-facial-recognition-challenges.pdf

Graphic:

Excerpt:

This paper is an introduction to AI technology designed for actuaries to understand how the technology works, the potential risks it could introduce, and how to mitigate risks. The author focuses on data bias as it is one of the main concerns of facial recognition technology. This research project was jointly sponsored by the Diversity Equity and Inclusion Research and the Actuarial Innovation and Technology Strategic Research Programs

Author(s): Victoria Zhang, FSA, FCIA

Publication Date: Jan 2023

Publication Site: SOA Research Institute

2022 Mortality Improvement Survey Report

Link: https://www.soa.org/resources/research-reports/2022/mort-improve-survey/

Report PDF: https://www.soa.org/4ad811/globalassets/assets/files/resources/research-report/2022/mort-improve-survey.pdf

Graphic:

Excerpt:

The Committee on Life Insurance Mortality and Underwriting Surveys of the Society of Actuaries sent
companies a survey in May of 2019 on mortality improvement practices as of year-end 2018. The survey
results were released in January 2022. The survey was completed by respondents prior to the onset of
COVID-19. The present report provides an opportunity to update the results for pandemic-based changes
and compare the before and after surveys.
The 2022 survey was opened in March 2022 and closed by the end of April. Thirty-five respondent
companies participated in this survey, with 29 from the U.S. and six from Canada. This group was further
divided between direct writers (26) and reinsurers (nine).
This survey focused on the use of mortality improvement and how it has changed for financial projection
and pricing modeling following the initial stages of COVID-19. Details regarding assumptions and opinions
on mortality improvement in general were asked of the respondents.
National Association of Insurance Commissioners discussions on mortality improvement factors due to
COVID-19 for reserving purposes have taken place, but this survey was conducted before any adjustments
reacting to them.
Seventy-four percent (26 of 35) of respondents indicated using durational mortality improvement
assumptions in their life and annuity pricing and/or financial projections. Moreover, of those that used
durational mortality improvement assumptions, attained age and gender were the top two characteristics
in which assumptions varied.
Respondents were asked to indicate the different limitations when applying durational mortality
improvement assumptions. The Survey found that the most common lowest and highest attained age to
which durational mortality improvement was applied were 0 and about 100, respectively. The lowest and
highest durational mortality improvement rate ranged from -1.50% (deterioration) to 2.80%
(improvement). The time period in which the mortality improvement rates were applied ranged from 10 to
120 years, but this varied between life (10/120) and annuities (30/120). The most common time period was
20 to 30 years for life; less consensus was seen for annuities. Analysis is provided in Appendix C for
instances when highlights are shared in the body of the report.

Author(s): Ronora Stryker, Max Rudolph

Publication Date: December 2022

Publication Site: SOA Research Institute

Transition to a High Interest Rate Environment: Preparing for Uncertainty

Link: https://www.soa.org/globalassets/assets/Files/Research/Projects/research-2015-rising-interest-rate.pdf

Graphic:

Excerpt:

Interest rates cycle over long periods of time. The journey tends to be unpredictable, full of
unexpected twists and turns. This project focuses on the impact of interest rate volatility on life
insurance products. As usual, it brought up more questions than it answered. It points out the
importance of stress testing for a specific block of business and the risk of relying on industry
rules of thumb. Understanding the nuances of models could make the difference between safe
navigation of a stressed environment and a default. Proactive and resilient practices should
increase the odds of success.


Hyman Minsky had it right—stability leads to instability. We live in an era where monetary
policies of central banks steer free markets in an effort to soften the business cycle. Rates have
been low for over 20 years in Japan, reshaping the global economy.

The primary goal of this paper is to explore rising interest rates, but that is not possible without
considering that some rates could stabilize at low levels or even decrease. Following this path,
the paper will look at implications of interest rate changes for the life insurance industry, current
stress testing practices, and how a risk manager can proactively prepare for an uncertain future.
A paper published in 2014 focused on why rates could stay low, and some aspects of this paper
are similar (e.g., description of insurance products). This paper also uses a sample model office
to help practitioners look at their own exposures. It includes typical interest-sensitive insurance
products and how they might perform across various scenarios, as well as a survey to establish
current practices for how insurers are testing interest rate risk currently.

Author(s): Max Rudolph, Randy Jorgensen, Karen Rudolph

Publication Date: July 2015

Publication Site: SOA Research Institute

Social and Other Determinants of Life Insurance Demand

Link: https://www.soa.org/resources/research-reports/2022/determinants-life-insurance/

Report: https://www.soa.org/4a50aa/globalassets/assets/files/resources/research-report/2022/determinants-life-insurance.pdf

Graphic:

Excerpt:

The authors examine 19 factors to determine which were most closely linked to permanent and term life insurance premiums sold in the United States in 2020. With spatial regression analysis using multi-scale geographically weighted regression (MGWR) approach, the authors find the following 5 covariates to be the most statistically significant for and positively correlated with permanent insurance sold: household income, percentage of the population that is African American, education, health insurance, and Gini index (a statistical measure of wealth inequality). For term insurance sold, the 5 most significant covariates are household income, education, Gini index, percentage of households with no vehicles, and health insurance. Their relationships with term insurance sold are positive except for the percentage of households with no vehicles.

Author(s):

Wilmer Martinez
Kyran Cupido
Petar Jevtic
Jianxi Su

Publication Date: August 2022

Publication Site: SOA

COVID Waves in 2020 Caused Bigger U.S Death Rate Spike Than 1918 Flu: Actuaries

Link:https://www.thinkadvisor.com/2022/01/26/covid-waves-in-2020-caused-bigger-u-s-death-rate-spike-than-1918-flu-actuaries/

Excerpt:

The pandemic led to the biggest U.S. death rate increase from causes other than COVID-19 since 1936.

The death rate in the highest-income counties increased to 736.1 deaths per 100,000 people, from 638.4 per 100,000 in 2019

For people ages 5 through 44, increases in the death rate from causes other than COVID-19 were much bigger than the increase caused directly by COVID-19.

Author(s): Allison Bell

Publication Date: 26 Jan 2021

Publication Site: Think Advisor

Emerging Technologies and their Impact on Actuarial Science

Link: https://www.soa.org/globalassets/assets/files/resources/research-report/2021/2021-emerging-technologies-report.pdf

Graphic:

Excerpt:

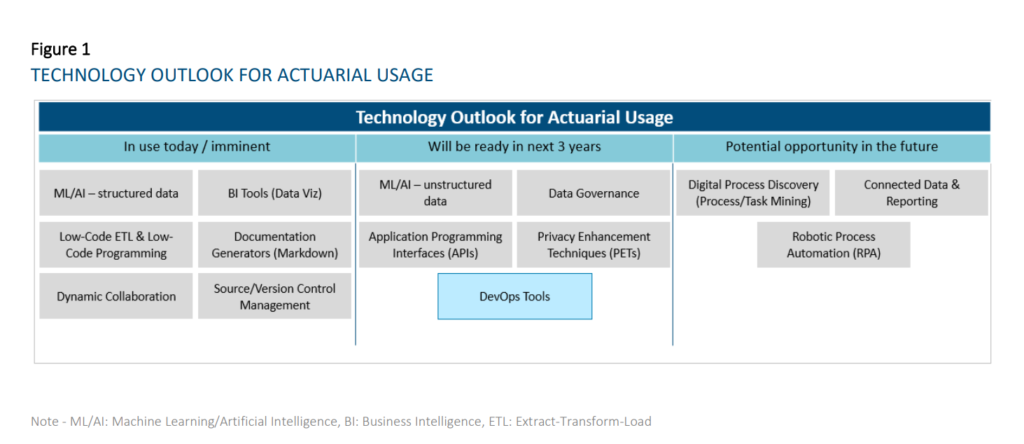
This research evaluates the current state and future outlook of emerging technologies on the actuarial profession
over a three-year horizon. For the purpose of this report, a technology is considered to be a practical application of
knowledge (as opposed to a specific vendor) and is considered emerging when the use of the particular technology
is not already widespread across the actuarial profession. This report looks to evaluate prospective tools that
actuaries can use across all aspects and domains of work spanning Life and Annuities, Health, P&C, and Pensions in
relation to insurance risk.
We researched and grouped similar technologies together for ease of reading and understanding. As a result, we
identified the six following technology groups:

  1. Machine Learning and Artificial Intelligence
  2. Business Intelligence Tools and Report Generators
  3. Extract-Transform-Load (ETL) / Data Integration and Low-Code Automation Platforms
  4. Collaboration and Connected Data
  5. Data Governance and Sharing
  6. Digital Process Discovery (Process Mining / Task Mining)

Author(s):

Nicole Cervi, Deloitte
Arthur da Silva, FSA, ACIA, Deloitte
Paul Downes, FIA, FCIA, Deloitte
Marwah Khalid, Deloitte
Chenyi Liu, Deloitte
Prakash Rajgopal, Deloitte
Jean-Yves Rioux, FSA, CERA, FCIA, Deloitte
Thomas Smith, Deloitte
Yvonne Zhang, FSA, FCIA, Deloitte

Publication Date: October 2021

Publication Site: Society of Actuaries, SOA Research Institute