Regulatory Capital Adequacy for Life Insurance Companies

Link: https://www.soa.org/4a194f/globalassets/assets/files/resources/research-report/2023/erm-191-reg-capital-with-final-visuals.pdf

Graphic:

Excerpt:

The purpose of this paper is to introduce the concept of capital and key related terms, as well as to compare and contrast four key regulatory capital regimes. Not only is each regime’s methodology explained with key terms defined and formulas provided, but illustrative applications of each approach are provided via an example with a baseline scenario. Comparison among these capital regimes is also provided using this same model with two alternative scenarios.

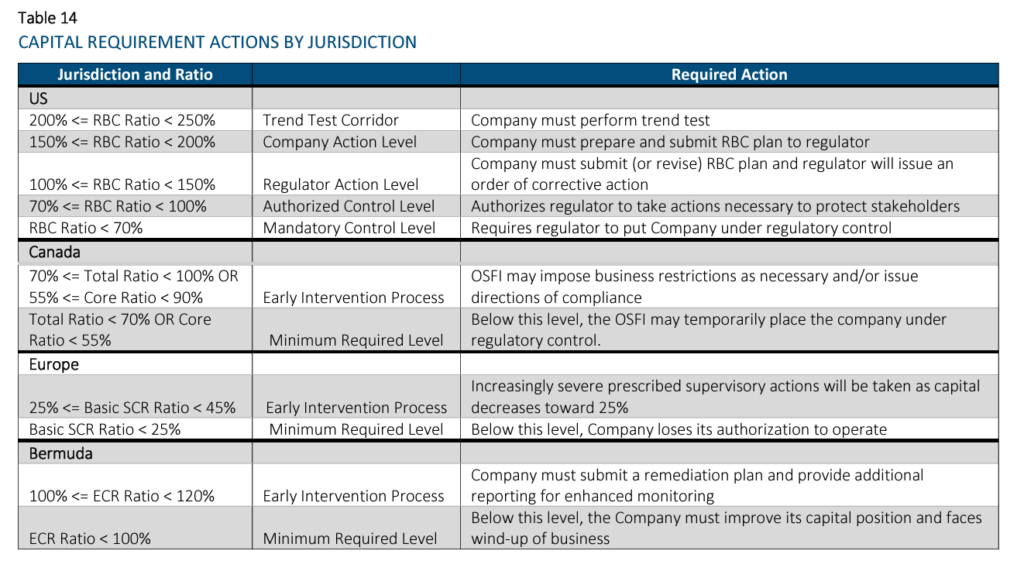
The four regulatory required capital approaches discussed in this paper are National Association of Insurance Commissioners’ (NAIC) Risk-Based Capital (RBC; the United States), Life Insurer Capital Adequacy Test (LICAT; Canada), Solvency II (European Union), and the Bermuda Insurance Solvency (BIS) Framework which describes the Bermuda Solvency Capital Requirement (BSCR). These terms may be used interchangeably. These standards apply to a large portion of the global life insurance market and were chosen to give the reader a better understanding of how required capital varies by jurisdiction, and the impact of the measurement method on life insurance company capital.

All of these approaches are similar in that they identify key risks for which capital should be held (e.g., asset default and market risks, insurance risks, etc.). However, they differ in significant ways too, including their defined risk taxonomy and risk diversification / aggregation methodologies, as well as required minimum capital thresholds and corresponding implications. Another key difference is that the US’s RBC methodology is largely factor-based, while the other methodologies are model-based approaches. For the model-based approaches, Solvency II and BIS allow for the use of internal models when certain conditions are satisfied. Another difference is that the RBC methodology is largely derived using book values, while the others use economic-based measurements.

As mentioned above, this paper provides a model that calculates the capital requirements for each jurisdiction. The model is used to compare regulatory solvency capital using identical portfolios for both assets and liabilities. For simplicity, we have assumed that all liabilities originated in the same jurisdiction as the calculation. As the objective of the model is to illustrate required capital calculation methodology differences, a number of modeling simplifications were employed and detailed later in the paper. The model considers two products – term insurance and payout annuities, approximately equally weighted in terms of reserves. The assets consist of two non-callable bonds of differing durations, mortgages, real estate, and equities. Two alternative scenarios have been considered, one where the company invests in riskier assets than assumed in the base case and one where the liability mix is more heavily weighted to annuities as compared to the base case.

Author(s): Ben Leiser, FSA, MAAA; Janine Bender, ASA, MAAA; Brian Kaul

Publication Date: July 2023

Publication Site: Society of Actuaries

Unhealthy Longevity in the United States

Link: https://www.soa.org/resources/research-reports/2023/unhealthy-longevity-us/

PDF: https://www.soa.org/4a525c/globalassets/assets/files/resources/research-report/2023/unhealthy-longevity-us.pdf

Graphic:

Excerpt:

The SOA Research Institute’s Mortality and Longevity Strategic Research Program is pleased to make available a research report that quantifies differences in mortality and disease prevalence by health status. Additionally, period life tables by health status, sex, and age are available in Appendix D.

Author(s):

Natalia S. Gavrilova, Ph.D.
Leonid A. Gavrilov, Ph.D.

NORC at the University of Chicago

Publication Date: August 2023

Publication Site: Society of Actuaries

Data Challenges in Building a Facial Recognition Model and How to Mitigate Them

Link: https://www.soa.org/resources/research-reports/2023/data-facial-rec/

PDF: https://www.soa.org/49022b/globalassets/assets/files/resources/research-report/2023/dei107-facial-recognition-challenges.pdf

Graphic:

Excerpt:

This paper is an introduction to AI technology designed for actuaries to understand how the technology works, the potential risks it could introduce, and how to mitigate risks. The author focuses on data bias as it is one of the main concerns of facial recognition technology. This research project was jointly sponsored by the Diversity Equity and Inclusion Research and the Actuarial Innovation and Technology Strategic Research Programs

Author(s): Victoria Zhang, FSA, FCIA

Publication Date: Jan 2023

Publication Site: SOA Research Institute

Impact of COVID-19 on Defined Benefit Pension Plan Funding

Link: https://www.theactuarymagazine.org/impact-of-covid-19-on-defined-benefit-pension-plan-funding/

Graphic:

Excerpt:

Higher interest rates already have translated into higher discount rates for solvency and accounting valuations, which means good news (lower liabilities) for DB pension plans. The sensitivity of a pension plan’s liabilities to the discount rate used to determine their value depends on the demographics of the plan members, the type of valuation and level of discount rates being used. Generally, the “duration” for most pension plan liabilities (defined here as the percentage decrease in liabilities for a 1% increase in discount rates) will range from 10 to 25.

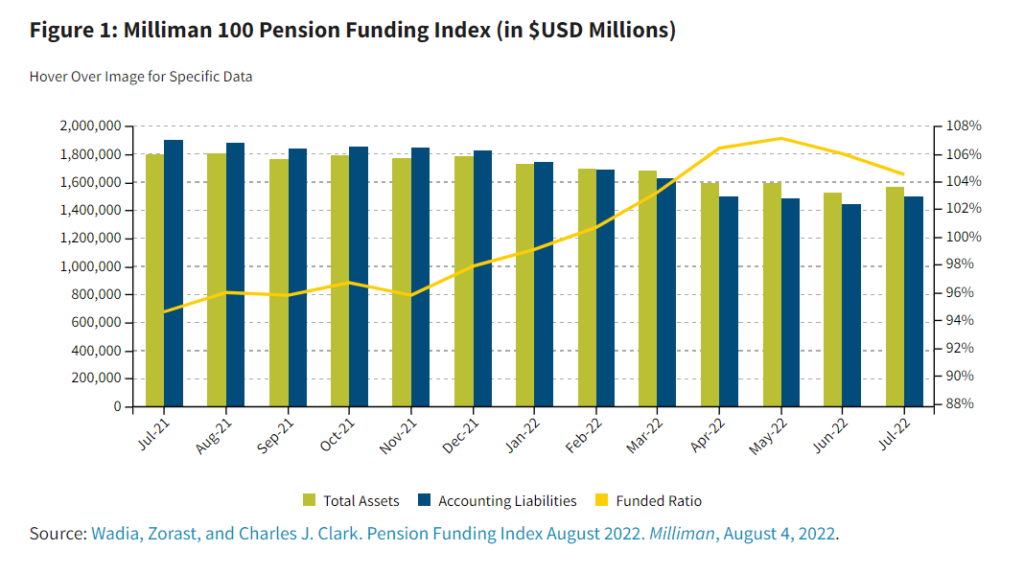
In the United States, the average accounting funded ratio increased from 94.6% in July 2021 to 104.5% in July 2022, according to the Milliman 100 Pension Funding Index, despite significant decreases in plan assets during that time. This is because the average accounting discount rate (typically based on long-term, high-quality bond yields) increased from 2.59% to 4.25% during that same period, driving down accounting liabilities at a faster pace than asset losses. Figure 1 demonstrates this effect in more detail.

Author(s): John Melinte

Publication Date: November 2022

Publication Site: The Actuary at SOA

2021 Risks and Process of Retirement Survey

Link: https://www.soa.org/resources/research-reports/2021/retirement-risk-survey/

Full report: https://www.soa.org/48fd8a/globalassets/assets/files/resources/research-report/2021/risks-retirement-findings.pdf

Graphic:

Excerpt:

CHAPTER HIGHLIGHTS:
• Despite the COVID-19 pandemic, level of concern about various risks remains historically low this year for both pre-retirees and retirees. Compared to 2019, level of concern dropped on some issues for retirees. As a result of this drop, retiree concerns are lower than those of pre-retirees by a larger gap than ever before.
• The one exception to this trend was concern about fraud. In 2021, both retirees and pre-retirees were
more concerned about fraud, and it is the highest concern among retirees, particularly Black/African
American retirees. As in prior studies, those with lower income tend to show much higher levels of
concern.
• The biggest concerns for pre-retirees are their savings and investments not keeping up with inflation, not being able to afford long-term care, not being able to afford health care costs, not being able to maintain a reasonable standard of living throughout retirement, and potentially depleting all their savings.
• While half of pre-retirees plan to retire gradually rather than all at once, retiree respondents indicate this
seldom actually happens. Higher-income pre-retirees are more likely to plan to go straight from full time
employment to retirement.
• The COVID-19 pandemic has not affected plans that pre-retirees have for work, living arrangements, and
lifestyle in retirement, although over a quarter report changing their lifestyle.
• Despite the financial challenges that retirement poses, most do not have financial advisors, especially preretirees, lower-income respondents, and Black/African American respondents.

Author(s): Greenwald Research

Publication Date: February 2022

Publication Site: Society of Actuaries

Group Life COVID-19 Mortality Survey Report

Link: https://www.soa.org/4a368a/globalassets/assets/files/resources/research-report/2022/group-life-covid-19-mortality-03-2022-report.pdf

Graphic:

Excerpt:

Tables 2.1 through 2.41 display high-level incidence results for the second quarter of 2020 through the first quarter of 2022 compared to the 2017-2019 baseline period for each combination of (a) incurred/reported basis and (b) count/amount basis as of March 31, 2022. In these tables, the number of COVID-19 claims has not been adjusted for seasonality, but the ratios to baseline have been adjusted for seasonality.


Note that additional data reported in April and May 2022 indicated that the 1Q 2022 excess mortality would likely complete downward from the 19.9% shown below using March data. The fully complete 1Q 2022 excess mortality is expected to remain above 15%.

….

The 24-month period of April 2020 through March 2022 showed the following Group Life mortality results:
• Estimated reported Group Life claim incidence rates were up 20.0% on a seasonally-adjusted basis
compared to 2017–2019 reported claims.
• Estimated incurred Group Life incidence rates were 20.9% higher than baseline on a seasonally-adjusted
basis. As noted above, the incurred incidence rates in February and March 2022 are based on fairly
incomplete data, so they are subject to change and should not be fully relied upon at this point.

Author(s):

Thomas J. Britt, FSA, MAAA
Paul Correia, FSA, MAAA
Patrick Hurley, FSA, MAAA
Mike Krohn, FSA, CERA, MAAA
Tony LaSala, FSA, MAAA
Rick Leavitt, ASA, MAAA
Robert Lumia, FSA, MAAA
Cynthia S. MacDonald, FSA, MAAA, SOA
Patrick Nolan, FSA, MAAA, SOA
Steve Rulis, FSA, MAAA
Bram Spector, FSA, MAAA

Publication Date: August 2022

Publication Site: SOA

Decentralized Insurance Alternatives: Market Landscape, Opportunities and Challenges

Link: https://www.soa.org/resources/research-reports/2022/decentralized-ins-alt/

Report: https://www.soa.org/4a6cf6/globalassets/assets/files/resources/research-report/2022/decentralized-ins-alt.pdf

Graphic:

Excerpt:

The DeFi ecosystem has been expanding rapidly in the past few years, growing from less than USD $1 billion in 2020 to USD $61.6 billion as of June 2022 as measured by Total Value Locked (TVL), the amount of crypto asset deposited in the DeFi protocols.

With continuous innovation in product design and delivery, the potential of DeFi adoption is massive. However, the rise of DeFi is marred by security issues. Nearly 200 blockchain hacking incidents have taken place in 2021 with approximately USD $7 billion in stolen funds (Cointelegraph, 2021). These hacking events have a wide range of causes including, but not limited to, the following:

  • Smart contract vulnerabilities exploited by hackers to steal funds
  • Manipulation of oracles to cause price feed deviation
  • Attack on governance where a small group of individuals took over the protocol’s governance decisionmaking mechanism

Author(s):

Alvin Kwock
OneDegree

Erik Lie, FSA, CERA
Hailstone Labs

Gwen Weng, FSA, CERA, FCIA
Hailstone Labs

Rex Zhang, ASA
OneDegree

Publication Date: Sept 2022

Publication Site: Society of Actuaries
A Risk Classification Framework for Decentralized Finance Protocols

Link: https://www.soa.org/resources/research-reports/2022/decentralized-finance-protocols/

Report: https://www.soa.org/4a61da/globalassets/assets/files/resources/research-report/2022/decentralized-finance-protocols.pdf

Graphic:

Excerpt:

Decentralized finance (DeFi) is an emerging and rapidly growing financial ecosystem with the defining feature that it is powered by blockchain technology. The focus of this paper is on risks for DeFi protocols that could lead to economic losses that could be insurable. This framework was designed around the risks associated with the existing and emerging DeFi protocols.

Author(s):

Tara Chang
OneDegree

Joe Ho
Hailstone Labs

Zachary Tirrell, FSA, FIAA

Gwen Weng, FSA, CERA, FCIA
Hailstone Labs

Jo You
OneDegree

Publication Date: October 2022

Publication Site: Society of Actuaries

Variations On Approximation – An Exploration in Calculation

Link: https://www.soa.org/news-and-publications/newsletters/compact/2014/january/com-2014-iss50/variations-on-approximation–an-exploration-in-calculation/

Graphic:

Excerpt:

Before we get into the different approaches, why should you care about knowing multiple ways to calculate a distribution when we have a perfectly good symbolic formula that tells us the probability exactly?

As we shall soon see, having that formula gives us the illusion that we have the “exact” answer. We actually have to calculate the elements within. If you try calculating the binomial coefficients up front, you will notice they get very large, just as those powers of q get very small. In a system using floating point arithmetic, as Excel does, we may run into trouble with either underflow or overflow. Obviously, I picked a situation that would create just such troubles, by picking a somewhat large number of people and a somewhat low probability of death.

I am making no assumptions as to the specific use of the full distribution being made. It may be that one is attempting to calculate Value at Risk or Conditional Tail Expectation values. It may be that one is constructing stress scenarios. Most of the places where the following approximations fail are areas that are not necessarily of concern to actuaries, in general. In the following I will look at how each approximation behaves, and why one might choose that approach compared to others.

Author(s): Mary Pat Campbell

Publication Date: January 2014

Publication Site: CompAct, SOA

Introduction to Credit Risk Exposure of Life Insurers

Link: https://www.soa.org/sections/joint-risk-mgmt/joint-risk-mgmt-newsletter/2022/september/rm-2022-09-fritz/

Graphic:

Excerpt:

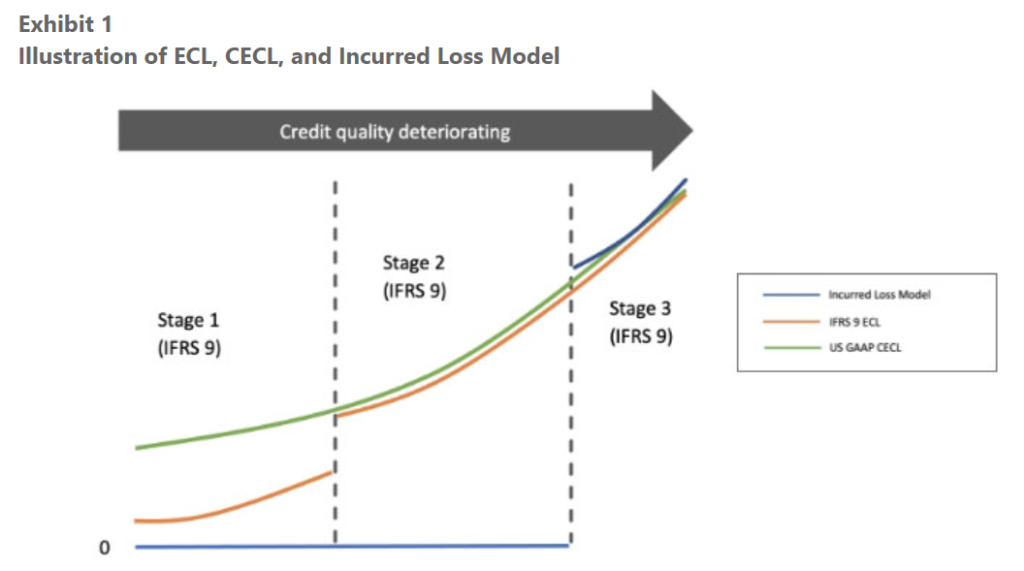
Under the old regime, the impairment was the incurred credit losses, in determining which only past events and current conditions are used. Credit losses were booked after a credit event had taken place, thus the name “incurred.” ECL and CECL require the incorporation of forward-looking information in addition to the past/current info in the calculation of impairment. There will be an allowance for credit losses since initial recognition regardless of the creditworthiness of the investment asset. The allowance can be perceived as the reserve or capital for credit risks. In practice, the allowance could be zero if there are no expected default losses for the instrument, US Treasury bonds, US Agency MBS, just to name a few.

ECL under IFRS 9 is typically calculated as a probability weighted estimate of the present value of cash shortfalls over the expected life of the financial instrument. It Is an unbiased best estimate with all cash shortfalls taking into consideration the collaterals or other credit enhancement. Four typical parameters underlying its calculation are: Probability of default (PD), loss given default (LGD, i.e., 1-Recovery Rate), exposure at default (EAD) and discounting factor (DF). Prepayments, usage given default (UGD) and other parameters can also play a role in the calculations. In the general approach the loss allowance for a financial instrument is 12-month ECL regardless of credit risk at the reporting date, unless there has been a significant increase in credit risk since initial recognition: The PD is only considered for the next 12 months while the cash shortfalls are predicted over the full lifetime; as the creditworthiness deteriorates significantly, the loss allowance is increased to full lifetime ECL in Stage 2, which should always precede stage 3 (credit impairment). Even without change of stages, any credit condition changes should be flowing into the credit loss allowance via updates in some of the underlying parameters. Exhibit 1 has an illustrative comparison between ECL, CECL, and incurred loss model.

CECL is similar to ECL except FASBs doesn’t have so-called staging as IFRS 9, which requires that only 12-month ECL is calculated in stage 1 (in the general model). In other words, CECL requires a full lifetime ECL from Day 1. There are also other differences: IFRS 9 requires certain consideration of time value of money, multiple scenarios, etc., in measurement of ECL while US GAAP CECL doesn’t.

Under US GAAP, different from CECL, currently the impairment for AFS assets, while also recorded as an allowance (with a couple exceptions), is only needed for those whose fair value is less than the amortized cost. Once it is triggered, the credit losses are then measured as the excess of the amortized cost basis over the probability weighted estimate of the present value of cash flows expected to be collected. Only the fair value change related to credit is considered in the calculation of AFS impairment. The quantitative calculation behind the probability weighted best estimate is like CECL/ECL. Both can use discounted cash flow methods with parameters such as PD although one is calculating expected cash shortfalls directly in CECL and the other is calculating the expected collectible cash payments and then is used to back out the impairment.

Author(s): Jing Fritz

Publication Date: September 2022

Publication Site: Risk Management newsletter, SOA

S&P Global’s Proposed Capital Model Changes and its Implication to U.S. Life Insurance Companies

Link: https://www.soa.org/sections/financial-reporting/financial-reporting-newsletter/2022/september/fr-2022-09-sun/

Graphic:

Excerpt:

Life technical risks measure the possible losses from deviations from the best estimate assumptions relating to life expectancy, policyholder behavior, and expenses. The life technical risks are captured through mortality, longevity, morbidity, and other risks. The methodology for calculating the capital adequacy for these four risk categories remains unchanged under the proposed method, apart from the recalibration of capital charges or the consolidation of defining categories within each risk. Comparing to the current GAAP based model, charges have materially increased across all categories partly due to higher confidence intervals, with notable exceptions of longevity risk, with reduced charges across all stress levels (changes applicable to U.S. life insurers are illustrated in Tables A2 to A5 in the Appendix linked at the end of this article). Please note that S&P’s current capital model under U.S. statutory basis does not have an explicit longevity risk charge. However, this article focuses on comparison to current GAAP capital model[1] that is closer to the new capital methodology framework.

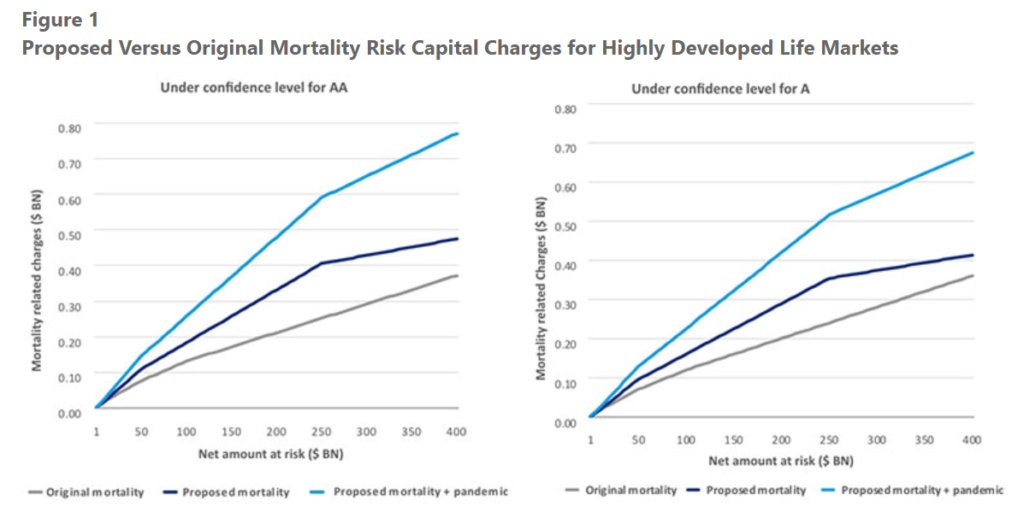
For mortality risk, lower rates are charged for smaller exposures (net amount at risk (NAR) $5 billion or less) with the consolidation of size categories, but higher rates are charged for NAR between $5 billion and $250 billion, with an average increase of 49 percent for businesses under $400 billion NAR. A new pandemic risk charge (Table A3 in the Appendix linked at the end of this article) will further increase mortality related risk charges to be 109 percent higher than original mortality charges under confidence level for company rating of AA, and 93 percent higher for confidence level for company rating of A, respectively, on average (Figure 1). The disability risk charge rates increased moderately for most products, across all eight product types such that the increase of disability premium risk charges is 6 percent under confidence level for AA, and 2 percent for A, respectively. In addition, the proposed model introduced a new charge on disability claims reserve, ranging from 13.7 percent of total disability claims reserves for AAA, to 9.6 percent for BBB. However, the proposed model provides lower capital charge rates in longevity risk and lapse risk.

Author(s): Yiru (Eve) Sun, John Choi, and Seong-Weon Park

Publication Date: September 2022

Publication Site: Financial Reporting newsletter of the SOA

A Fresh Look at Accounting for Reinsurance of Universal Life

Link: https://www.soa.org/sections/financial-reporting/financial-reporting-newsletter/2022/september/fr-2022-09-malerich/

Excerpt:

Under LDTI, DAC amortization will no longer obscure the relationship between direct and ceded accounting. It is now possible to align ceded accounting with direct, without any noise from DAC amortization. With poor alignment, distortions within the results reported to management and financial statement users will be different, sometimes greater than before. Whether the goal is to improve reporting or to avoid making it worse, a fresh look can help.

Most of the approaches that have been used to account for UL reinsurance can still be used. One exception is the implicit approach where, in lieu of explicit accounting for reinsurance, the gross profits used to amortize DAC were adjusted to be net of reinsurance. With the elimination of gross profits as an amortization base, this approach no longer has meaning.

For surviving approaches, it is now easier to evaluate their effectiveness in presenting the economic protection provided by reinsurance.

In this article, I begin an evaluation by examining the fundamentals of accounting for the insurance element of universal life. After that, I consider the economic protection provided by reinsurance and look for an ideal—a way to effectively account for that protection.

In a second article to be published later this year, I’ll evaluate several reinsurance approaches in terms of noise from missing the ideal, then end with some thoughts on what might be done to eliminate noise.

The focus of both articles is on the insurance element. Accounting for the deposit element, embedded derivatives, and market risk benefits is beyond the scope of these articles. Also outside of scope is the requirement, in Accounting Standards Codification (ASC) Topic 326, to recognize a current estimate of credit losses from the failure of a reinsurer to reimburse reinsured benefits.

Author(s): Steve Malerich

Publication Date: Sept 2022

Publication Site: Financial Reporting newsletter, SOA