Graphic:

Author(s): Kristen Mizzi Angelone
Publication Date: 25 Jan 2022
Publication Site: Pew
All about risk
Graphic:

Author(s): Kristen Mizzi Angelone
Publication Date: 25 Jan 2022
Publication Site: Pew
Link:https://www.nytimes.com/2021/11/18/well/mind/suicide-black-kids.html
Excerpt:
A 2018 study found that while the suicide rate of Black children ages 5 to 12 was low, it was nearly twice that of white children in the same age group. In one of the most recent examples, a 10-year-old Black girl with autism died by suicide in Utah in early November. Her parents said she had been subjected to racist bullying by her classmates.
Among teenagers and young adults, suicide rates remain highest among whites, Native Americans and Alaska Natives. But while the suicide rate has recently declined among those groups, it has continued to rise among Black youths. From 2013 to 2019 the suicide rate of Black boys and men ages 15 to 24 rose by 47%, and by 59% for Black girls and women of the same age.
…..
Deaths by suicide are more common among boys than girls overall, but a study published in September found that suicide rates among Black girls increased by an average of 6.6% each year from 2003 to 2017 — more than twice the increase for Black boys. A diagnosis of depression or anxiety was more common among the girls. Additionally, nearly 20% of the girls had engaged in an argument within 24 hours of their deaths.
Author(s): Christina Caron
Publication Date:18 Nov 2021
Publication Site: NYT
Link:https://marypatcampbell.substack.com/p/covid-mortality-update-for-november
Graphic:


Excerpt:
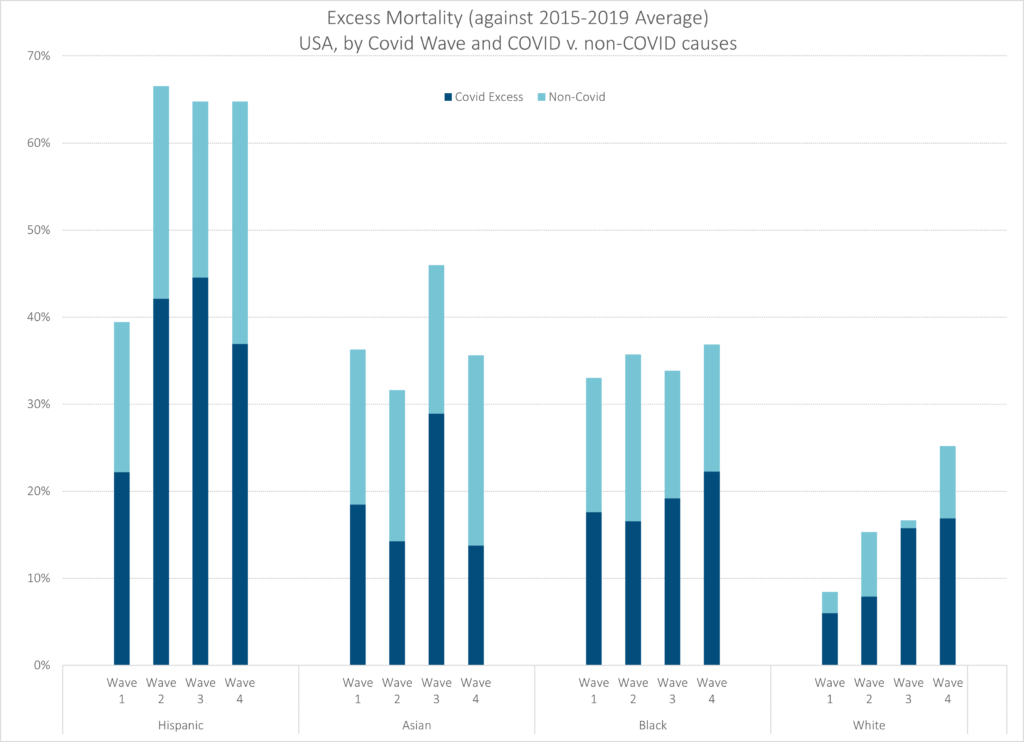
As noted earlier, the Hispanic excess mortality was about a level as the other non-White groups, but then spiked with Wave 2 and stayed very high.
The Asian group saw its excess mortality peak with Wave 3 — remember, that’s the large wave with the most COVID deaths. But they have been at about 30 – 35% excess mortality for the other waves.
The Black group looks like it’s slightly rising in excess mortality, but staying within a fairly narrow range of about 33% to 37% excess mortality.
The White group is definitely showing an increasing trend of excess mortality. Interesting.
Due to the White group’s increasing excess mortality, the overall population is showing an increasing trend — look, Whites have been the majority of deaths for a long time, as they’re the majority of old folks. That’s how that works.
Author(s): Mary Pat Campbell
Publication Date: 28 Nov 2021
Publication Site: STUMP at substack
Link:https://marypatcampbell.substack.com/p/on-covid-excess-mortality-by-raceethnicity
Graphic:


Video:
Excerpt:
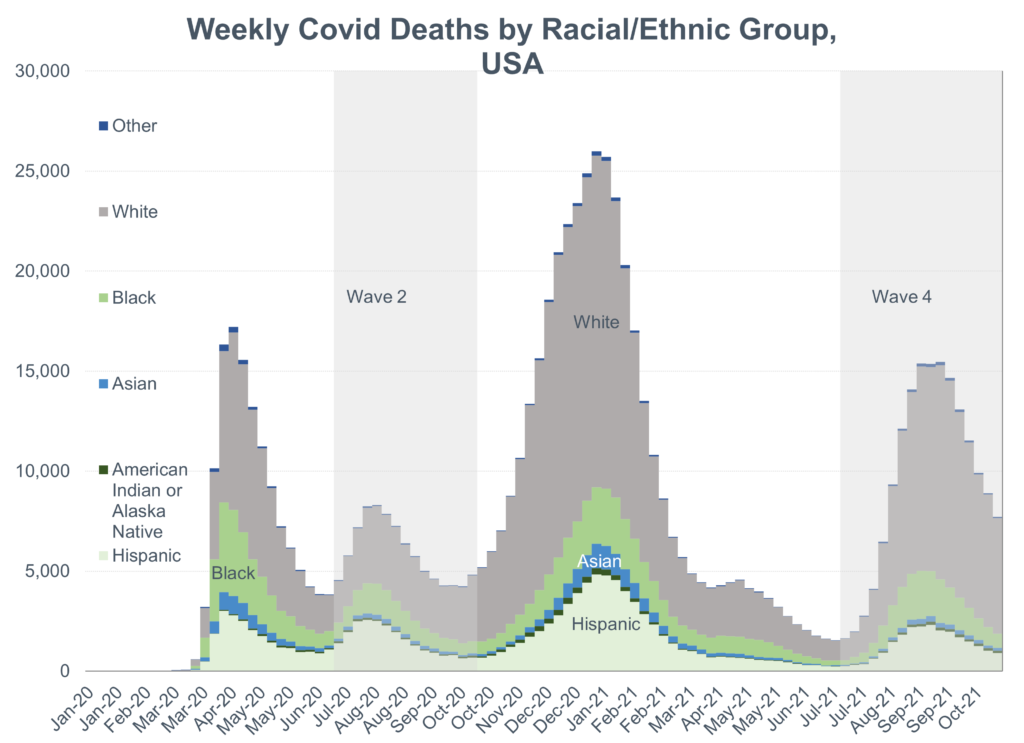
And now you can see it — the blue curve for Hispanics has a summer 2020 peak much higher than that for whites, Blacks, and Asians.
I want to note the high peak for Asian deaths in winter 2020-2021.
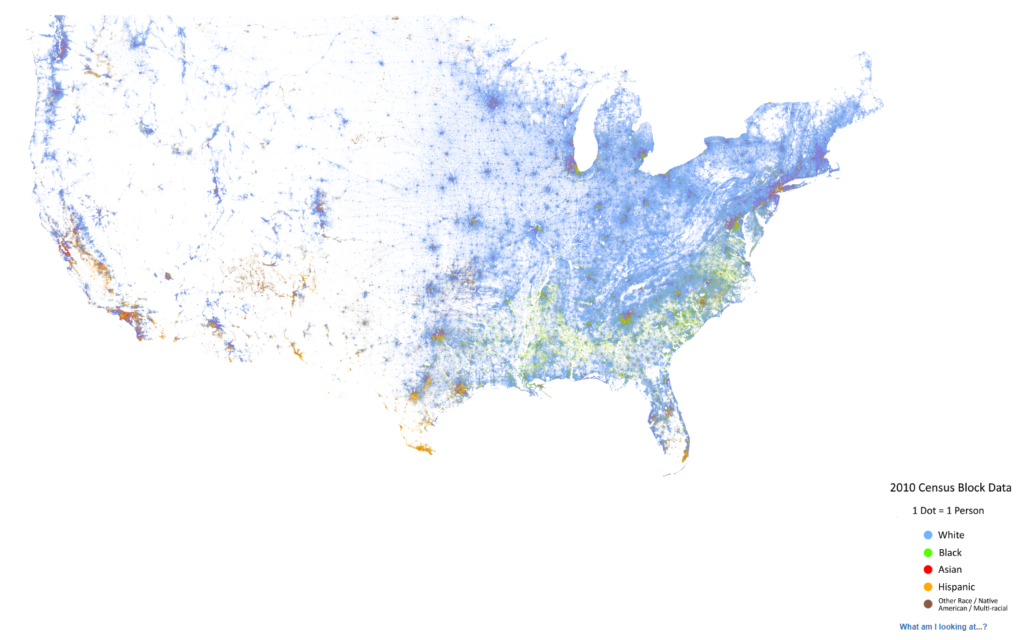
See that there is a high spike for Asian, Hispanic, and Black in that first NYC-centered wave that we’ve known so well… but a little blip for White. And I want you to think about that a little. Because that really explains a lot of the disproportionate effects on minorities in the U.S. and it goes back to Charles Blow’s question at the top of this post.
The answer to all of this being geographic distribution.
Author(s): Mary Pat Campbell
Publication Date: 6 Nov 2021
Publication Site: STUMP at substack
Link: https://www.soa.org/prof-dev/webcasts/2021-ending-jim-crow/
Description:
This session will introduce a late 19th century article by actuary FL Hoffman. This article provided a justification for racially discriminatory life insurance premiums – a practice that existed well into the 20th century and was consistent with “Jim Crow” thinking. Join the presenters as they discuss the reasons that Hoffman’s article was actuarially unsound using commentaries at the time it was written as well as recent publications that include important reflections on the actuarial profession that apply both historically and in the present. The session will discuss thoughts about how Hoffman’s work would be received and handled today, including the role of the ABCD in such matters, several rules and regulations that now guide actuarial conduct and are designed to prevent discriminatory practices, and actuarial ethical responsibilities. The session will conclude with an observation that one of the best ways for the actuarial profession to prevent the use of racially discriminatory practices in our work is by having a diverse actuarial profession with members who will provide first-hand perspectives about inappropriate actuarial practices.
Author(s):
Jay M. Jaffe, FSA, MAAA
Reinsurance Administration, Ltd.
Webcast Date (to come): 10 November 2021
Publication Site: SOA
Link:https://reason.com/2021/10/14/the-racial-gap-among-the-vaccinated-has-essentially-disappeared/
Excerpt:
According to a new survey from the Kaiser Family Foundation, as the rate of U.S. adults who report having received at least one dose of the COVID-19 vaccines continues to climb, the rates among racial groups are now basically identical, comprising 71 percent of white adults, 70 percent of black adults, and 73 percent of Hispanic adults. President Joe Biden’s proposed mandate for all private-sector employees to be vaccinated has yet to take effect, so this is a good sign for the efficacy of general persuasion over a top-down mandate.
Author(s): Joe Lancaster
Publication Date: 14 Oct 2021
Publication Site: Reason
Link:https://www.themarshallproject.org/2021/08/30/the-black-mortality-gap-and-a-century-old-document
Graphic:

Excerpt:
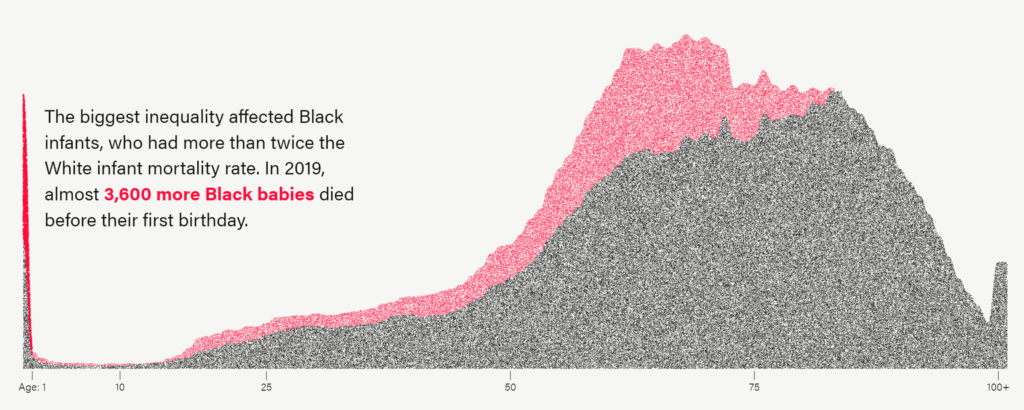
Black Americans die at higher rates than White Americans at nearly every age.
In 2019, the most recent year with available mortality data, there were over 62,000 such earlier deaths — or one out of every five African American deaths.
The age group most affected by the inequality was infants. Black babies were more than twice as likely as White babies to die before their first birthday.
The overall mortality disparity has existed for centuries. Racism drives some of the key social determinants of health, like lower levels of income and generational wealth; less access to healthy food, water and public spaces; environmental damage; overpolicing and disproportionate incarceration; and the stresses of prolonged discrimination.
But the health care system also plays a part in this disparity.
Author(s): Anna Flagg
Publication Date: 30 Aug 2021
Publication Site: The Marshall Project
Link:https://www.nber.org/papers/w29203
Graphic:

Excerpt:
Although there is a large gap between Black and White American life expectancies, the gap fell 48.9% between 1990-2018, mainly due to mortality declines among Black Americans. We examine age-specific mortality trends and racial gaps in life expectancy in rich and poor U.S. areas and with reference to six European countries.
Inequalities in life expectancy are starker in the U.S. than in Europe. In 1990 White Americans and Europeans in rich areas had similar overall life expectancy, while life expectancy for White Americans in poor areas was lower. But since then even rich White Americans have lost ground relative to Europeans. Meanwhile, the gap in life expectancy between Black Americans and Europeans decreased by 8.3%.
Black life expectancy increased more than White life expectancy in all U.S. areas, but improvements in poorer areas had the greatest impact on the racial life expectancy gap. The causes that contributed the most to Black mortality reductions included: Cancer, homicide, HIV, and causes originating in the fetal or infant period.
Life expectancy for both Black and White Americans plateaued or slightly declined after 2012, but this stalling was most evident among Black Americans even prior to the COVID-19 pandemic. If improvements had continued at the 1990-2012 rate, the racial gap in life expectancy would have closed by 2036. European life expectancy also stalled after 2014. Still, the comparison with Europe suggests that mortality rates of both Black and White Americans could fall much further across all ages and in both rich and poor areas.
Author(s): Hannes Schwandt, Janet Currie, Marlies Bär, James Banks, Paola Bertoli, Aline Bütikofer, Sarah Cattan, Beatrice Zong-Ying Chao, Claudia Costa, Libertad Gonzalez, Veronica Grembi, Kristiina Huttunen, René Karadakic, Lucy Kraftman, Sonya Krutikova, Stefano Lombardi, Peter Redler, Carlos Riumallo-Herl, Ana Rodríguez-González, Kjell Salvanes, Paula Santana, Josselin Thuilliez, Eddy van Doorslaer, Tom Van Ourti, Joachim Winter, Bram Wouterse & Amelie Wuppermann
DOI 10.3386/w29203
WORKING PAPER 29203
Publication Date: September 2021
Publication Site: NBER
Link:https://www.wsj.com/articles/why-black-lives-got-longer-nber-longevity-racial-gap-11631905217
Excerpt:
“Between 1990 and 2018,” the paper reports, “the U.S. White-Black life expectancy gap decreased from 7.0 to 3.6 years.” A black person born in the U.S. in 1990 could be expected to live to about age 69, compared to 76 for a white person. In the intervening generation, black life expectancy rose about twice as fast as white life expectancy. A black person born in 2018 could be expected to live just over age 75, compared to just under 79 for a white person.
The drivers, the authors say, are primarily “greater reductions in Black relative to White death rates due to cancer, homicide, HIV, and causes originating in the fetal or infant period.” The most pronounced reductions in black mortality are among children and adults under age 65, rather than the elderly.
“Deaths of despair” (deaths from suicide, drug overdoses, and alcohol-related disease) increased among black and white Americans, especially in the last decade, but took a larger toll on white life expectancy. That accounted for 16.2% of the narrowing of the racial gap. The linear extension of life expectancies for both races stopped after 2012, meaning that it’s hard to see much effect from ObamaCare’s health insurance expansion in the data.
Author(s): The Editorial Board
Publication Date: WSJ
Publication Site: 11 Oct 2021
Link:https://pediatrics.aappublications.org/content/pediatrics/early/2021/10/06/peds.2021-053760.full.pdf
Graphic:

Excerpt:
Methods: We quantified COVID-19-associated caregiver loss and orphanhood in the US and for
each state using fertility and excess and COVID-19 mortality data. We assessed burden and rates
of COVID-19-associated orphanhood and deaths of custodial and co-residing grandparents,
overall and by race/ethnicity. We further examined variations in COVID-19-associated
orphanhood by race/ethnicity for each state.
Results: We found that from April 1, 2020 through June 30, 2021, over 140,000 children in the
US experienced the death of a parent or grandparent caregiver. The risk of such loss was 1.1 to
4.5 times higher among children of racial and ethnic minorities, compared to Non-Hispanic
White children. The highest burden of COVID-19-associated death of parents and caregivers
occurred in Southern border states for Hispanic children, Southeastern states for Black children,
and in states with tribal areas for American Indian/Alaska Native populations.
Author(s): Hillis SD, Blenkinsop A, Villaveces A, et al.
Publication Date: 2021, accessed 12 Oct 2021
DOI: 10.1542/peds.2021-053760
Citation: Hillis SD, Blenkinsop A, Villaveces A, et al. COVID-19-associated orphanhood and
caregiver death in the United States. Pediatrics. 2021; doi: 10.1542/peds.2021-053760
Publication Site: Pediatrics
Link: https://eml.berkeley.edu//~crwalters/papers/randres.pdf
Graphic:

Abstract:
We study the results of a massive nationwide correspondence experiment sending more than
83,000 fictitious applications with randomized characteristics to geographically dispersed jobs
posted by 108 of the largest U.S. employers. Distinctively Black names reduce the probability of
employer contact by 2.1 percentage points relative to distinctively white names. The magnitude
of this racial gap in contact rates differs substantially across firms, exhibiting a between-company
standard deviation of 1.9 percentage points. Despite an insignificant average gap in contact rates
between male and female applicants, we find a between-company standard deviation in gender
contact gaps of 2.7 percentage points, revealing that some firms favor male applicants while
others favor women. Company-specific racial contact gaps are temporally and spatially persistent,
and negatively correlated with firm profitability, federal contractor status, and a measure of
recruiting centralization. Discrimination exhibits little geographical dispersion, but two digit
industry explains roughly half of the cross-firm variation in both racial and gender contact gaps.
Contact gaps are highly concentrated in particular companies, with firms in the top quintile of
racial discrimination responsible for nearly half of lost contacts to Black applicants in the
experiment. Controlling false discovery rates to the 5% level, 23 individual companies are found
to discriminate against Black applicants. Our findings establish that systemic illegal
discrimination is concentrated among a select set of large employers, many of which can be
identified with high confidence using large scale inference methods.
Author(s): Patrick M. Kline, Evan K. Rose, and Christopher R. Walters
Publication Date: July 2021, Revised August 2021
Publication Site: NBER Working Papers, also Christopher R. Walters’s own webpages
Link: https://leg.colorado.gov/sites/default/files/2021a_169_signed.pdf
Link: https://leg.colorado.gov/bills/sb21-169
Excerpt:
The general assembly therefore declares that in order to ensure
that all Colorado residents have fair and equitable access to insurance
products, it is necessary to:
(a) Prohibit:
(I) Unfair discrimination based on race, color, national or ethnic
origin, religion, sex, sexual orientation, disability, gender identity, or gender
expression in any insurance practice; and
(II) The use of external consumer data and information sources, as
well as algorithms and predictive models using external consumer data and
information sources, which use has the result of unfairly discriminating
based on race, color, national or ethnic origin, religion, sex, sexual
orientation, disability, gender identity, or gender expression; and
(b) After notice and rule-making by the commissioner of insurance,
require insurers that use external consumer data and information sources,
algorithms, and predictive models to control for, or otherwise demonstrate
that such use does not result in, unfair discrimination.
Publication Date: 6 July 2021
Publication Site: Colorado Legislature