The insurance industry’s renewed focus on disparate impacts and unfair discrimination

Link: https://www.milliman.com/en/insight/the-insurance-industrys-renewed-focus-on-disparate-impacts-and-unfair-discrimination

Excerpt:

As consumers, regulators, and stakeholders demand more transparency and accountability with respect to how insurers’ business practices contribute to potential systemic societal inequities, insurers will need to adapt. One way insurers can do this is by conducting disparate impact analyses and establishing robust systems for monitoring and minimizing disparate impacts. There are several reasons why this is beneficial:

  1. Disparate impact analyses focus on identifying unintentional discrimination resulting in disproportionate impacts on protected classes. This potentially creates a higher standard than evaluating unfairly discriminatory practices depending on one’s interpretation of what constitutes unfair discrimination. Practices that do not result in disparate impacts are likely by default to also not be unfairly discriminatory (assuming that there are also no intentionally discriminatory practices in place and that all unfairly discriminatory variables codified by state statutes are evaluated in the disparate impact analysis).
  2. Disparate impact analyses that align with company values and mission statements reaffirm commitments to ensuring equity in the insurance industry. This provides goodwill to consumers and provides value to stakeholders.
  3. Disparate impact analyses can prevent or mitigate future legal issues. By proactively monitoring and minimizing disparate impacts, companies can reduce the likelihood of allegations of discrimination against a protected class and corresponding litigation.
  4. If writing business in Colorado, then establishing a framework for assessing and monitoring disparate impacts now will allow for a smooth transition once the Colorado bill goes into effect. If disparate impacts are identified, insurers have time to implement corrections before the bill is effective.

Author(s): Eric P. Krafcheck

Publication Date: 27 Sept 2021

Publication Site: Milliman

Want to Be an Actuary? Odds Are, You’ll Fail the Test

Link:https://www.wsj.com/articles/actuary-credential-test-exam-bad-odds-11640706082?st=52aicn5y38okulw&reflink=article_email_share

Graphic:

(the answer: B — I’ll leave it to you to verify the calculations)

Excerpt:

Actuaries quantify risk. One of their riskiest endeavors is trying to become one.

Among people taking at least one exam from the Society of Actuaries—the field’s biggest U.S. credentialing body—15% eventually pass the multiple tests required to become an Associate, one of two designations allowing them to practice. Just 10% pass those and additional tests to become a Fellow, the group’s higher designation, which affords bigger responsibilities and salaries.

It’s such an arduous process that the number of test-takers has been declining in recent years, and the society is making changes to keep candidates from dropping out of the gantlet. It is also adding new “predictive analytics” tests to adjust to the massive amounts of data insurers now have.

There is no limit to how many times a candidate can take the tests. It took one man 50 years to become a Fellow, says Stuart Klugman, an official at the society. The society says a candidate typically takes seven to 10 years to become a Fellow. They must pass 10 exams plus other coursework and requirements.

Author(s): Neal Templin

Publication Date: 28 Dec 2021

Publication Site: WSJ

Applying Predictive Analytics for Insurance Assumptions—Setting Practical Lessons

Graphic:

Excerpt:

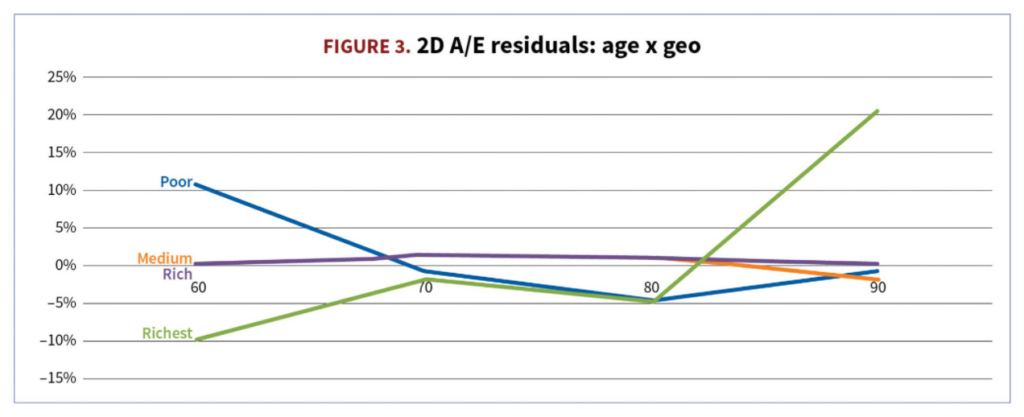
3. Identify pockets of good and poor model performance. Even if you can’t fix it, you can use this info in future UW decisions. I really like one- and two-dimensional views (e.g., age x pension amount) and performance across 50 or 100 largest plans—this is the precision level at which plans are actually quoted. (See Figure 3.)

What size of unexplained A/E residual is satisfactory at pricing segment level? How often will it occur in your future pricing universe? For example, 1-2% residual is probably OK. Ten to 20% in a popular segment likely indicates you have a model specification issue to explore.

Positive residuals mean that actual mortality data is higher than the model predicts (A>E). If the model is used for pricing this case, longevity pricing will be lower than if you had just followed the data, leading to a possible risk of not being competitive. Negative residuals mean A<E, predicted mortality being too high versus historical data, and a possible risk of price being too low.

Author(s): Lenny Shteyman, MAAA, FSA, CFA

Publication Date: September/October 2021

Publication Site: Contingencies

Idea Behind LIME and SHAP

Link: https://towardsdatascience.com/idea-behind-lime-and-shap-b603d35d34eb

Graphic:

Excerpt:

In machine learning, there has been a trade-off between model complexity and model performance. Complex machine learning models e.g. deep learning (that perform better than interpretable models e.g. linear regression) have been treated as black boxes. Research paper by Ribiero et al (2016) titled “Why Should I Trust You” aptly encapsulates the issue with ML black boxes. Model interpretability is a growing field of research. Please read here for the importance of machine interpretability. This blog discusses the idea behind LIME and SHAP.

Author(s): ashutosh nayak

Publication Date: 22 December 2019

Publication Site: Toward Data Science