Covid National Emergency Ends

Link: https://kelleyk.substack.com/p/covid-national-emergency-ends

Graphic:

Excerpt:

Biden signed H.J.Res. 7, which ended the national emergency for Covid. Both the text of the bill, and the corresponding press release from the White House are short and sweet. The White House recently said Biden “strongly opposes HJ Res 7,” but that he would sign the bill if it passed. It passed with bipartisan support in both the House.

One thing that is tied to the national emergency is an extension of COBRA deadlines for people who are out of work. These deadlines are extended during the “outbreak period” which ends 60 days after the end of the national emergency.

The DHS rules for vaccine mandates for foreign travelers at land border crossings from Canada and Mexico rely on the national emergency as their legal basis, so theoretically they will end with the national emergency. But there has been no official actions to lift those rules, and I suspect the White House expects this vaccine mandate to continue for at least another month. (See section on travel vaccine mandates further down for more details.)

Author(s): Kelly K

Publication Date: 11 April 2023

Publication Site: Check Your Work

Physical interventions to interrupt or reduce the spread of respiratory viruses

Link: https://www.cochranelibrary.com/cdsr/doi/10.1002/14651858.CD006207.pub6/full

https://doi.org/10.1002/14651858.CD006207.pub6

Graphic:

Excerpt:

Background

Viral epidemics or pandemics of acute respiratory infections (ARIs) pose a global threat. Examples are influenza (H1N1) caused by the H1N1pdm09 virus in 2009, severe acute respiratory syndrome (SARS) in 2003, and coronavirus disease 2019 (COVID‐19) caused by SARS‐CoV‐2 in 2019. Antiviral drugs and vaccines may be insufficient to prevent their spread. This is an update of a Cochrane Review last published in 2020. We include results from studies from the current COVID‐19 pandemic.

Objectives

To assess the effectiveness of physical interventions to interrupt or reduce the spread of acute respiratory viruses.

Search methods

We searched CENTRAL, PubMed, Embase, CINAHL, and two trials registers in October 2022, with backwards and forwards citation analysis on the new studies.

Selection criteria

We included randomised controlled trials (RCTs) and cluster‐RCTs investigating physical interventions (screening at entry ports, isolation, quarantine, physical distancing, personal protection, hand hygiene, face masks, glasses, and gargling) to prevent respiratory virus transmission. 

Data collection and analysis

We used standard Cochrane methodological procedures.

Main results

We included 11 new RCTs and cluster‐RCTs (610,872 participants) in this update, bringing the total number of RCTs to 78. Six of the new trials were conducted during the COVID‐19 pandemic; two from Mexico, and one each from Denmark, Bangladesh, England, and Norway. We identified four ongoing studies, of which one is completed, but unreported, evaluating masks concurrent with the COVID‐19 pandemic.

Many studies were conducted during non‐epidemic influenza periods. Several were conducted during the 2009 H1N1 influenza pandemic, and others in epidemic influenza seasons up to 2016. Therefore, many studies were conducted in the context of lower respiratory viral circulation and transmission compared to COVID‐19. The included studies were conducted in heterogeneous settings, ranging from suburban schools to hospital wards in high‐income countries; crowded inner city settings in low‐income countries; and an immigrant neighbourhood in a high‐income country. Adherence with interventions was low in many studies.

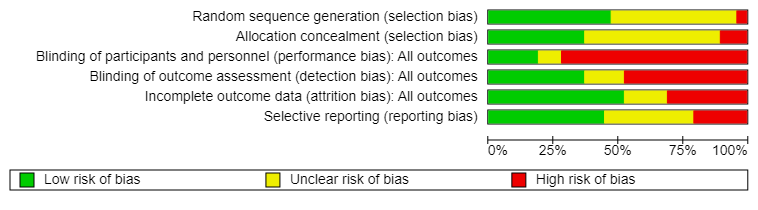
The risk of bias for the RCTs and cluster‐RCTs was mostly high or unclear.

Medical/surgical masks compared to no masks

We included 12 trials (10 cluster‐RCTs) comparing medical/surgical masks versus no masks to prevent the spread of viral respiratory illness (two trials with healthcare workers and 10 in the community). Wearing masks in the community probably makes little or no difference to the outcome of influenza‐like illness (ILI)/COVID‐19 like illness compared to not wearing masks (risk ratio (RR) 0.95, 95% confidence interval (CI) 0.84 to 1.09; 9 trials, 276,917 participants; moderate‐certainty evidence. Wearing masks in the community probably makes little or no difference to the outcome of laboratory‐confirmed influenza/SARS‐CoV‐2 compared to not wearing masks (RR 1.01, 95% CI 0.72 to 1.42; 6 trials, 13,919 participants; moderate‐certainty evidence). Harms were rarely measured and poorly reported (very low‐certainty evidence).

N95/P2 respirators compared to medical/surgical masks

We pooled trials comparing N95/P2 respirators with medical/surgical masks (four in healthcare settings and one in a household setting). We are very uncertain on the effects of N95/P2 respirators compared with medical/surgical masks on the outcome of clinical respiratory illness (RR 0.70, 95% CI 0.45 to 1.10; 3 trials, 7779 participants; very low‐certainty evidence). N95/P2 respirators compared with medical/surgical masks may be effective for ILI (RR 0.82, 95% CI 0.66 to 1.03; 5 trials, 8407 participants; low‐certainty evidence). Evidence is limited by imprecision and heterogeneity for these subjective outcomes. The use of a N95/P2 respirators compared to medical/surgical masks probably makes little or no difference for the objective and more precise outcome of laboratory‐confirmed influenza infection (RR 1.10, 95% CI 0.90 to 1.34; 5 trials, 8407 participants; moderate‐certainty evidence). Restricting pooling to healthcare workers made no difference to the overall findings. Harms were poorly measured and reported, but discomfort wearing medical/surgical masks or N95/P2 respirators was mentioned in several studies (very low‐certainty evidence). 

One previously reported ongoing RCT has now been published and observed that medical/surgical masks were non‐inferior to N95 respirators in a large study of 1009 healthcare workers in four countries providing direct care to COVID‐19 patients. 

Hand hygiene compared to control

Nineteen trials compared hand hygiene interventions with controls with sufficient data to include in meta‐analyses. Settings included schools, childcare centres and homes. Comparing hand hygiene interventions with controls (i.e. no intervention), there was a 14% relative reduction in the number of people with ARIs in the hand hygiene group (RR 0.86, 95% CI 0.81 to 0.90; 9 trials, 52,105 participants; moderate‐certainty evidence), suggesting a probable benefit. In absolute terms this benefit would result in a reduction from 380 events per 1000 people to 327 per 1000 people (95% CI 308 to 342). When considering the more strictly defined outcomes of ILI and laboratory‐confirmed influenza, the estimates of effect for ILI (RR 0.94, 95% CI 0.81 to 1.09; 11 trials, 34,503 participants; low‐certainty evidence), and laboratory‐confirmed influenza (RR 0.91, 95% CI 0.63 to 1.30; 8 trials, 8332 participants; low‐certainty evidence), suggest the intervention made little or no difference. We pooled 19 trials (71, 210 participants) for the composite outcome of ARI or ILI or influenza, with each study only contributing once and the most comprehensive outcome reported. Pooled data showed that hand hygiene may be beneficial with an 11% relative reduction of respiratory illness (RR 0.89, 95% CI 0.83 to 0.94; low‐certainty evidence), but with high heterogeneity. In absolute terms this benefit would result in a reduction from 200 events per 1000 people to 178 per 1000 people (95% CI 166 to 188). Few trials measured and reported harms (very low‐certainty evidence).

We found no RCTs on gowns and gloves, face shields, or screening at entry ports.

Authors’ conclusions

The high risk of bias in the trials, variation in outcome measurement, and relatively low adherence with the interventions during the studies hampers drawing firm conclusions. There were additional RCTs during the pandemic related to physical interventions but a relative paucity given the importance of the question of masking and its relative effectiveness and the concomitant measures of mask adherence which would be highly relevant to the measurement of effectiveness, especially in the elderly and in young children.

There is uncertainty about the effects of face masks. The low to moderate certainty of evidence means our confidence in the effect estimate is limited, and that the true effect may be different from the observed estimate of the effect. The pooled results of RCTs did not show a clear reduction in respiratory viral infection with the use of medical/surgical masks. There were no clear differences between the use of medical/surgical masks compared with N95/P2 respirators in healthcare workers when used in routine care to reduce respiratory viral infection. Hand hygiene is likely to modestly reduce the burden of respiratory illness, and although this effect was also present when ILI and laboratory‐confirmed influenza were analysed separately, it was not found to be a significant difference for the latter two outcomes. Harms associated with physical interventions were under‐investigated.

There is a need for large, well‐designed RCTs addressing the effectiveness of many of these interventions in multiple settings and populations, as well as the impact of adherence on effectiveness, especially in those most at risk of ARIs. 

Author(s): Tom Jefferson, Liz Dooley, Eliana Ferroni, Lubna A Al-Ansary, Mieke L van Driel, Ghada A Bawazeer, Mark A Jones, Tammy C Hoffmann, Justin Clark, Elaine M Beller, Paul P Glasziou, John M Conly

Publication Date: 30 Jan 2023

Publication Site: Cochrane Library

The End of the COVID-19 Public Health Emergency: Details on Health Coverage and Access

Link: https://www.kff.org/policy-watch/the-end-of-the-covid-19-public-health-emergency-details-on-health-coverage-and-access/

Excerpt:

On Jan. 30, 2023, the Biden Administration announced it will end the public health emergency (and national emergency) declarations on May 11, 2023. Here’s what major health policies will and won’t change when the public health emergency ends.

Vaccines

What’s changing: Nothing. The availability, access, and costs of COVID-19 vaccines, including boosters, are determined by the supply of federally purchased vaccines, not the public health emergency.

What’s the same: As long as federally purchased vaccines last, COVID-19 vaccines will remain free to all people, regardless of insurance coverage. Providers of federally purchased vaccines are not allowed to charge patients or deny vaccines based on the recipient’s coverage or network status.

….

At-home COVID tests

What’s changing: At-home (or over-the-counter) tests may become more costly for people with insurance. After May 11, 2023, people with traditional Medicare will no longer receive free, at-home tests. Those with private insurance and Medicare Advantage (private Medicare plans) no longer will be guaranteed free at-home tests, but some insurers may continue to voluntarily cover them.

For those on Medicaid, at-home tests will be covered at no-cost through September 2024. After that date, home test coverage will vary by state.

….

COVID Treatment

What’s changing: People with public coverage may start to face new cost-sharing for pharmaceutical COVID treatments (unless those doses were purchased by the federal government, as discussed below). Medicare beneficiaries may face cost-sharing requirements for certain COVID pharmaceutical treatments after May 11. Medicaid and CHIP programs will continue to cover all pharmaceutical treatments with no-cost sharing through September 2024. After that date, these treatments will continue to be covered; however, states may impose utilization limits and nominal cost-sharing.

….

Author(s): Cynthia Cox Follow @cynthiaccox on Twitter , Jennifer Kates Follow @jenkatesdc on Twitter , Juliette Cubanski Follow @jcubanski on Twitter , and Jennifer Tolbert

Publication Date: 3 Feb 2023

Publication Site: Kaiser Family Foundation

Life expectancy assumptions could fall by 6 months if CMI proposals adopted

Link: https://www.lcp.uk.com/media-centre/2023/02/life-expectancy-assumptions-could-fall-by-6-months-if-cmi-proposals-adopted/

Excerpt:

The CMI has issued its consultation to help shape the next version of its mortality projection model, which is used by the majority of pension scheme trustees and sponsors in setting their funding and accounting assumptions. The consultation focuses on how to respond to the very high mortality rates seen in England & Wales over 2022, to which the model is calibrated. 

The CMI believe mortality in 2022 may be indicative of future mortality to some extent, unlike the exceptional mortality seen in 2020 and 2021 during the peak of the pandemic.  

The key proposal is to give 25% weight to the 2022 mortality data. In the coming years, the CMI plan to steadily increase the weight on mortality data until around 2025, by which time it expects a clearer indication of mortality trends of the future. The CMI also intend to update the model to use the latest population estimates based on the 2021 Census. 

Both of these changes reduce projected life expectancy relative to previous versions of the model. 

Chris Tavener, Partner and Head of Life Analytics commented: “If these proposals go ahead then life expectancy assumptions at age 65 are likely to fall by around 6 months, equivalent to 2%, when adopting the new core model, all else being equal. This is a larger fall in life expectancies compared to recent model updates, but we share the concern expressed by the CMI that higher death rates seen in the latter part of 2022, and continuing into January, may be indicative of future mortality. 

“We are seeing an increasing number of pension scheme trustees and sponsors look to us to understand how  their own members are likely to be affected by the various factors driving recent higher death rates, such as the ramifications of the pandemic and pressures on the healthcare system, which in our view will affect some groups more than others.” 

Publication Date: 1 Feb 2023

Publication Site: Lane Clark & Peacock

Masks Make ‘Little or No Difference’ on COVID-19, Flu Rates: New Study

Link: https://reason.com/2023/02/07/masks-covid-dont-work-cochrane-library-review-mandate/

Excerpt:

The wearing of masks to prevent the spread of COVID-19 and other respiratory illnesses had almost no effect at the societal level, according to a rigorous new review of the available research.

“Interestingly, 12 trials in the review, ten in the community and two among healthcare workers, found that wearing masks in the community probably makes little or no difference to influenza-like or COVID-19-like illness transmission,” writes Tom Jefferson, a British epidemiologist and co-author of the Cochrane Library’s new report on masking trials. “Equally, the review found that masks had no effect on laboratory-confirmed influenza or SARS-CoV-2 outcomes. Five other trials showed no difference between one type of mask over another.”

That finding is significant, given how comprehensive Cochrane’s review was. The randomized control trials had hundreds of thousands of participants, and made useful comparisons: people who received masks—and, according to self-reporting, actually wore them—versus people who did not. Other studies that have tried to uncover the efficacy of mask requirements have tended to compare one municipality with another, without taking into account relevant differences between the groups. This was true of an infamous study of masking in Arizona schools conducted at the county level; the findings were cited by the Centers for Disease Control and Prevention (CDC) as reason to keep mask mandates in place.

Author(s): Robby Soave

Publication Date: 7 Feb 2023

Publication Site: Reason

Traffic Safety Impact of the COVID-19 Pandemic: Fatal Crashes Relative to Pre-Pandemic Trends, United States, May–December 2020

Link: https://aaafoundation.org/traffic-safety-impact-of-the-covid-19-pandemic-fatal-crashes-relative-to-pre-pandemic-trends-united-states-may-december-2020/

PDF: https://aaafoundation.org/wp-content/uploads/2022/12/22-1339-AAAFTS_Impact-of-COVID-19_Research-Brief_r3.pdf

Graphic:

Excerpt:

A total of 38,824 people died in motor vehicle crashes in the U.S. in 2020, 2,570 (7.1%) more than forecast from models developed using data from 2011 through 2019 (Figure). In April 2020—the first full month of the pandemic—the number of fatalities was much lower than what would have been expected based on pre-pandemic trends. By May 2020, however, the actual number of fatalities was similar to historical levels. The number of fatalities greatly exceeded forecasts based on pre-pandemic trends for the remainder of 2020. In May through December collectively, there were a total of 28,611 traffic fatalities nationwide, which was 3,083 (12.1%) more than expected based on pre-pandemic trends.

The increase in traffic fatalities was not uniform across crash-, vehicle-, and driver-related factors. Scenarios present in greater than expected numbers in fatal crashes in 2020 included evening and late-night hours, speeding drivers, drivers with illegal alcohol levels, drivers without valid licenses, drivers of older vehicles, drivers of vehicles registered to other people, crash involvement and deaths of teens and young adults, and deaths of vehicle occupants not wearing seatbelts. In contrast, several crash types followed pre-pandemic trends (e.g., crashes in the middle of the day; crash involvements of drivers with valid licenses; pedestrian fatalities), and a few decreased (e.g., crashes of elderly drivers; crashes during typical morning commute hours).

Author(s): Brian C. Tefft, Meng Wang

Publication Date: December 2022

Publication Site: AAA Foundation

Movember 2022: Men and Drug Overdoses (and Giving Tuesday!)

Link: https://marypatcampbell.substack.com/p/movember-2022-men-and-drug-overdoses

Graphic:

Excerpt:

Remember the graph I made showing the suicide trend for men crossing over from prostate cancer?

Let me layer on unintentional drug overdoses:

Yeah, it’s as bad as it looks.

While death rates due to suicide increased by about 30% over the 20-year period, death rates due to unintentional drug overdoses increased by over 500%.

None of this is really a surprise. I’ve written about the drug OD problem many times before, which had a horrible trend before the pandemic and got much, much worse during the pandemic.

Much of the increase came in 2020 and 2021 — over 30% in 2020, and 17% in 2021. These are huge increases on rates that were already bad.

Author(s): Mary Pat Campbell

Publication Date: 29 Nov 2022

Publication Site: STUMP at substack

Reductions in US life expectancy during the COVID-19 pandemic by race and ethnicity: Is 2021 a repetition of 2020?

Link: https://www.ncbi.nlm.nih.gov/pmc/articles/PMC9432732/

Graphic:

Abstract:

COVID-19 had a huge mortality impact in the US in 2020 and accounted for most of the overall reduction in 2020 life expectancy at birth. There were also extensive racial/ethnic disparities in the mortality impact of COVID-19 in 2020, with the Black and Latino populations experiencing reductions in life expectancy at birth over twice as large as that of the White population. Despite continued vulnerability of these populations, the hope was that widespread distribution of effective vaccines would mitigate the overall mortality impact and reduce racial/ethnic disparities in 2021. In this study, we quantify the mortality impact of the COVID-19 pandemic on 2021 US period life expectancy by race and ethnicity and compare these impacts to those estimated for 2020. Our estimates indicate that racial/ethnic disparities have persisted, and that the US population experienced a decline in life expectancy at birth in 2021 of 2.2 years from 2019, 0.6 years more than estimated for 2020. The corresponding reductions estimated for the Black and Latino populations are slightly below twice that for Whites, suggesting smaller disparities than those in 2020. However, all groups experienced additional reductions in life expectancy at birth relative to 2020, and this apparent narrowing of disparities is primarily the result of Whites experiencing proportionately greater increases in mortality in 2021 compared with the corresponding increases in mortality for the Black and Latino populations in 2021. Estimated declines in life expectancy at age 65 increased slightly for Whites between 2020 and 2021 but decreased for both the Black and Latino populations, resulting in the same overall reduction (0.8 years) estimated for 2020 and 2021.

Author(s): Theresa Andrasfay, Noreen Goldman

Publication Date: 31 Aug 2022

Publication Site: PLOS ONE

Citation: Andrasfay T, Goldman N. Reductions in US life expectancy during the COVID-19 pandemic by race and ethnicity: Is 2021 a repetition of 2020? PLoS One. 2022 Aug 31;17(8):e0272973. doi: 10.1371/journal.pone.0272973. PMID: 36044413; PMCID: PMC9432732.

Tax Revenue in Most States Surpasses Pre-Pandemic Growth Trend

Link: https://www.pewtrusts.org/en/research-and-analysis/data-visualizations/2014/fiscal-50

Graphic:

Excerpt:

As the first quarter of 2022 came to an end and the United States passed the two-year anniversary of the start of the COVID-19 pandemic, total state tax revenue was at its highest level since just before its historic decline in early 2020. Collections were 18.1% greater than those for the final quarter of 2019, after adjusting for inflation and averaging across four quarters to smooth seasonal fluctuations. Only Wyoming and North Dakota had not taken in enough revenue to surpass their pre-pandemic levels.

Nationwide and in 31 states as of the end of the first quarter of 2022, cumulative tax receipts since the pandemic’s start, adjusted for inflation, were even higher than they would have been if pre-COVID growth trends had continued—despite fallout from the pandemic and a two-month recession. According to Pew estimates, Idaho led all states, with 16% more cumulative tax revenue than it would have collected under its pre-pandemic growth rate. New Mexico was second at 15.5% above the trend. Nationally, combined tax revenue at the end of the first quarter of 2022 was 3% above estimates of what might have been collected had the pandemic not occurred.

However, estimates also show that cumulative tax revenue fell short of its pre-COVID growth trend in slightly more than a third of states since the pandemic’s onset, and most other states’ recoveries largely followed historical trends.

Looking at cumulative totals since the start of the pandemic offers a way to identify states in which tax revenue has over- or underperformed since January 2020, based on pre-COVID trends. This approach also provides a different view of the strength of collections from the often-astonishing quarterly and annual percentage increases that were skewed by this particularly volatile period. For each of the nine quarters from Jan. 1, 2020 to March 31, 2022, Pew calculated the difference between actual tax revenue and estimates of how much each state would have collected had revenue grown at its pre-pandemic, five-year average annual growth rate.

Author(s): Melissa Maynard

Publication Date: 7 Sept 2022

Publication Site: Pew Trusts

Will Survivors of the First Year of the COVID-19 Pandemic Have Lower Mortality?

Link: https://crr.bc.edu/working-papers/will-survivors-of-the-first-year-of-the-covid-19-pandemic-have-lower-mortality/

Report: https://crr.bc.edu/wp-content/uploads/2022/08/wp_2022-10.pdf

Graphic:

Abstract:

The mortality burden of the COVID-19 pandemic was particularly heavy among older adults, racial and ethnic minorities, and those with underlying health conditions.  These groups are known to have higher mortality rates than others even in the absence of COVID.  Using data from the 2019 American Community Survey, the 2018 Health and Retirement Study, and the 2020 National Vital Statistics System, this paper estimates how much lower the overall mortality rate will be for those who lived through the acute phase of the early pandemic after accounting for this selection effect of those who died from COVID.  Such selection may have implications for life insurance and annuity premiums, as well as assessments of the financial standing of Social Security – if the selection is large enough to substantially alter projected survivor mortality.

The paper found that:

  • 10-year mortality rates, absent direct COVID deaths and long COVID, will likely be lower in 2021 than anticipated in 2019.
  • However, these differences are small, ranging from a decline of 0.4 percentage points for people in their 60s to 1 percentage point for those in their 90s.
  • The small difference is in spite of the fact that COVID mortality was, indeed, very selective, with mortality declines exceeding half the maximum possible declines, holding total COVID deaths constant, for every age group.

 
The policy implications of the findings are:

  • That declines in mortality due to COVID selection likely will not impact overall population mortality substantially enough to affect Social Security cost projections.
  • Any impact of selection effects on Social Security costs will likely be swamped by ongoing mortality increases directly attributable to acute and long COVID.

Author(s): Gal Wettstein, Nilufer Gok, Anqi Chen, Alicia H. Munnell

Publication Date: August 2022

Publication Site: Center for Retirement Research at Boston College

The Impacts of Covid-19 Illnesses on Workers

Link: https://siepr.stanford.edu/publications/working-paper/impacts-covid-19-illnesses-workers

Graphic:

Excerpt:

We show that Covid-19 illnesses persistently reduce labor supply. Using an event study, we estimate that workers with week-long Covid-19 work absences are 7 percentage points less likely to be in the labor force one year later compared to otherwise-similar workers who do not miss a week of work for health reasons. Our estimates suggest Covid-19 illnesses have reduced the U.S. labor force by approximately 500,000 people (0.2 percent of adults) and imply an average forgone earnings per Covid-19 absence of at least $9,000, about 90 percent of which reflects lost labor supply beyond the initial absence week.

Author(s):

Gopi Shah Goda
Evan J. Soltas

Publication Date: Sept 2022

Publication Site: Stanford University, Stanford Institute for Economic Policy Research (SIEPR)

2020-2021 Excess Deaths in the U.S. General Population by Age and Sex

Link: https://www.soa.org/resources/research-reports/2022/excess-death-us/

Full report: https://www.soa.org/4a55a7/globalassets/assets/files/resources/research-report/2022/excess-death-us.pdf

Graphic:

Excerpt:

The data used for this analysis was provided by the CDC as of August 17, 2022 and includes incurred deaths
by week, beginning on December 29, 2019 and going through July 2, 2022. For 2020, the CDC defines Week
1 as ranging from December 29, 2019 through January 4, 2020 and Week 52 as ranging from December 19,
2020 through December 26, 2020, so when reporting on 2020 results, this convention is used. The year
2021 begins on December 27, 2020 and runs through January 2, 2022. For the purposes of this analysis, the
start of the COVID-19 active period is March 22, 2020.
Due to the delay in reporting, the actual deaths have been completed based on factors that vary by age
and sex. These are shown below along with the expectations that are based on the five-year trend after
adjusting for seasonality.

These data are as of August 17, 2022 and exclude deaths that occurred after July 2, 2022. Figure 1 shows
that, for most months, the total A/E ratio is much greater than 100%, while the A/E ratio excluding COVID19 deaths is also greater than 100% by a few percent.

Author(s): Rick Leavitt, ASA, MAAA

Publication Date: August 2022

Publication Site: Society of Actuaries Research Institute