How I Created a Data Visualization With Zero Coding Skills, Thanks to ChatGPT

Link: https://nightingaledvs.com/data-visualization-using-chatgpt-to-code/

Graphic:
Excerpt:

Data visualization is cool but at the same time it’s bit daunting that I need to know lots of tech stacks to actually implement it.

I totally agree that even when I was studying data visualization, I spent a pretty substantial amount of time learning how to code, handle web hosting, work with Python, SQL, and more, all while absorbing knowledge on information visualization.

Thankfully, we no longer need to deep dive into technical gatekeepers in this field. This doesn’t mean that technical knowledge is not valuable, but rather that we no longer need to be intimidated by technology because AI can spoon-feed us knowledge and do the heavy lifting for us. Are you excited? Let’s get started!

I’m going to build the data visualization that one of my students posted on weekly write-up homework.

Author(s): Soonk Paik

Publication Date: 4 April 2023

Publication Site: Nightingale

Reasons to Visualise the Same Data, Differently

Link: https://nightingaledvs.com/reasons-to-visualise-the-same-data-differently/

Graphic:

Excerpt:

To quote Andy Kirk, “we can look at data, but we cannot really see it. To see data, we need to represent it in a different, visual form.” So, in an attempt to make data more accessible, you may create more visual representations – dots, lines, shapes, and colours. These building blocks combine to create all sorts of charts and pictures helping readers understand numbers. 

Although the purpose of visualising data is clear (and universal), the reasons can be different. The reason you visualise data, will help you determine the appropriate visual.

Author(s): Kat Greenbrook

Publication Date: 8 Sept 2022

Publication Site: Nightingale

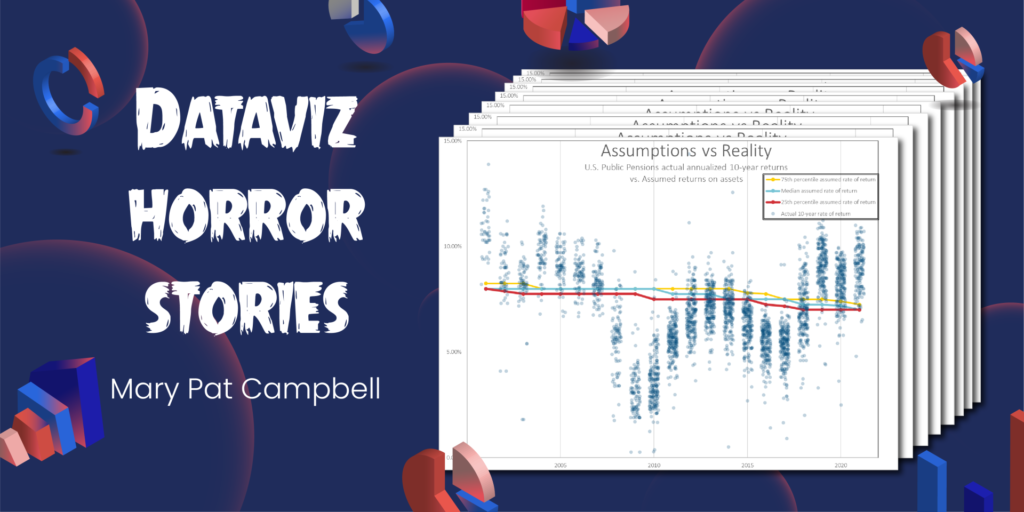
Dataviz Horror Story: How I Crashed the Top Exec’s Email

Link: https://nightingaledvs.com/dataviz-horror-story-how-i-crashed-the-top-execs-email/

Graphic:

Video:

Excerpt:

In my case, the graphs I made looked just fine—it’s just that I didn’t understand how copy/pasting graphs between Excel and Word worked (at the time). This was in the mid-2000s, when memory wasn’t quite so plentiful, so many corporate email accounts had memory quotas. If you hit that quota, you would be locked out of your email account. You had to call IT and actually talk to a person! 

I was a lowly entry-level person at a financial services company and had done some Monte Carlo modeling involving 1,000,000 scenarios. We were developing a new mutual fund project, based on changing allocations over time as people moved towards retirement, and the company wanted me to model outcomes for different allocation trajectories.  After a “full” model run of one million scenarios, I made diagnostic graphs showing the distribution of key metrics (such as the annual accumulation of the fund, how many times the fund decreased while the owner was in retirement, and whether – and when – the money in the fund ran out)  so that we could analyze different potential fund strategies. The graphs themselves were fairly simple. 

Author(s): Mary Pat Campbell

Publication Date: 31 Aug 2022

Publication Site: Nightingale

I’ve Stopped Using Box Plots. Should You?

Link:https://nightingaledvs.com/ive-stopped-using-box-plots-should-you/

Graphic:

Excerpt:

Well, as far as I can tell, the only advantage of box plots is that they show quartile ranges. The obvious next question, of course, is how often it’s necessary to show quartile ranges in order to say what you need to say about the data. In my experience, it’s not nearly as often as a lot of chart creators seem to think. Most of the time, you’re pointing out that distributions are higher or lower than one another, more concentrated or more dispersed than one another, have outliers, etc. None of these types of insights require showing quartile ranges and all can be communicated using simpler chart types. Some types of insights might require showing medians, but those can be easily added to simpler chart types:

Author(s): Nick Desbarats

Publication Date: 4 Nov 2021

Publication Site: Nightingale

Credit Where Credit is Due: Mary Eleanor Spear

Link: https://medium.com/nightingale/credit-where-credit-is-due-mary-eleanor-spear-6a7a1951b8e6

Graphic:

Excerpt:

On page 166 of her 1952 book, in a chapter titled “The Bar Chart”, Spear shows very clearly an early form of a chart type called the Box Plot that she calls the “Range Bar.” …..

What’s interesting about this to me is that if you look up the Wikipedia page for Box Plot, at the present moment, you will not find Spear’s name appearing anywhere in the article. You will, however, read the following:

“Since the mathematician John W. Tukey introduced this type of visual data display in 1969, several variations on the traditional box plot have been described.”

The way I see it, the range bar appearing in Spear’s book is close enough in form to the box plot to warrant a mention on this Wikipedia page. Hopefully, by the time you read this, you’ll be able to find an updated page for the box plot with her name included on it.

Author(s): Ben Jones

Publication Date: 6 August 2019

Publication Site: Nightingale at Medium

Florence Nightingale is a Design Hero

Link: https://medium.com/nightingale/florence-nightingale-is-a-design-hero-8bf6e5f2147

Graphic:

Excerpt:

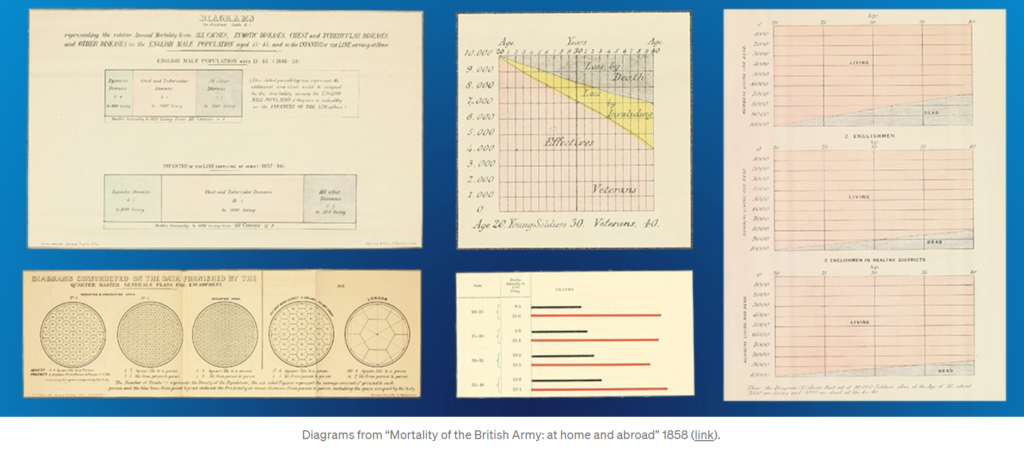
On trips through Europe, Nightingale displayed a natural inclination to record data: distance and times traveled were neatly cataloged in her journal. She hoarded information pamphlets, especially those concerning laws, social conditions, and benevolent institutions. In a Parisian salon, Mary Clarke showed Nightingale how bold, independent, intelligent, and equal to men a woman can be.

In Egypt, Nightingale cruised the Nile and discovered ancient mysticism. Near Thebes, God called Florence Nightingale to nursing. God called me in the morning and asked me would I do good for him alone without reputation. But rich kids do not become nurses. Nursing was below Nightingale’s class. Her family disapproved.

Author(s): RJ Andrews

Publication Date: 15 July 2019

Publication Site: Nightingale at Medium

New Nightingale Editorial Standards

Link: https://medium.com/nightingale/new-nightingale-editorial-standards-6cada1125d7d

Excerpt:

Always include a high-resolution image at the top of your story. This has the following benefits:

When people share your story on Facebook and Twitter, it will be more prominent in news feeds, making people more likely to click on it.

Our readers prefer images of data visualizations.

If you’re having a hard time, you can always look at the free-image services like PixabayPexels, or Unsplash or discuss it with your editor.

Author(s): Jason Forrest

Publication Date: 22 February 2021

Publication Site: Nightingale at Medium

Demystifying Vaccination Metrics

Link: https://medium.com/nightingale/demystifying-vaccination-metrics-cd0a29251dd2

Graphic:

Excerpt:

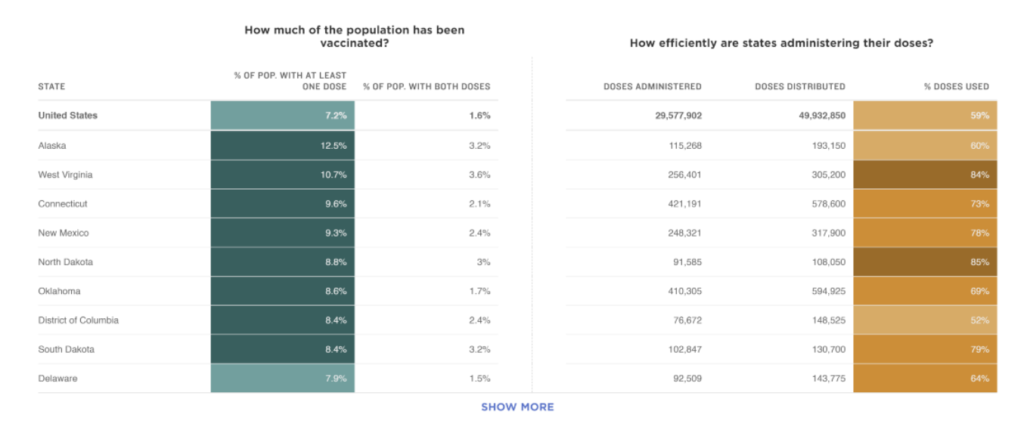
3. Display distribution (supply) and administration (demand) data together for a more complete picture of the vaccine rollout.

To make sense of what was happening with COVID cases, charts from groups like the COVID-19 Tracking Project clustered trends on testing, cases, hospitalizations, and deaths for a more complete picture. Similarly, we can’t look at data on doses administered in isolation to understand how a country or state is performing on vaccine rollout.

The New York Times displays a combination of the percent of people given at least one shot or two shots and information about the doses distributed and the share of doses used. Together, these metrics give a high level snapshot of information about supply distributed and administered. Note that understanding demand requires knowing more than how many people received shots though, which is likely influenced by supply.

Author(s): Amanda Makulec

Publication Date: 1 February 2021

Publication Site: Nightingale at Medium