Mortality in the United States — Provisional Data, 2023

Link: https://www.cdc.gov/mmwr/volumes/73/wr/mm7331a1.htm?s_cid=mm7331a1_w

Graphic:

FIGURE 1Provisional* number of COVID-19–associated deaths and other deaths and percentage of deaths associated with COVID-19, by week of death — National Vital Statistics System, United States, 2023
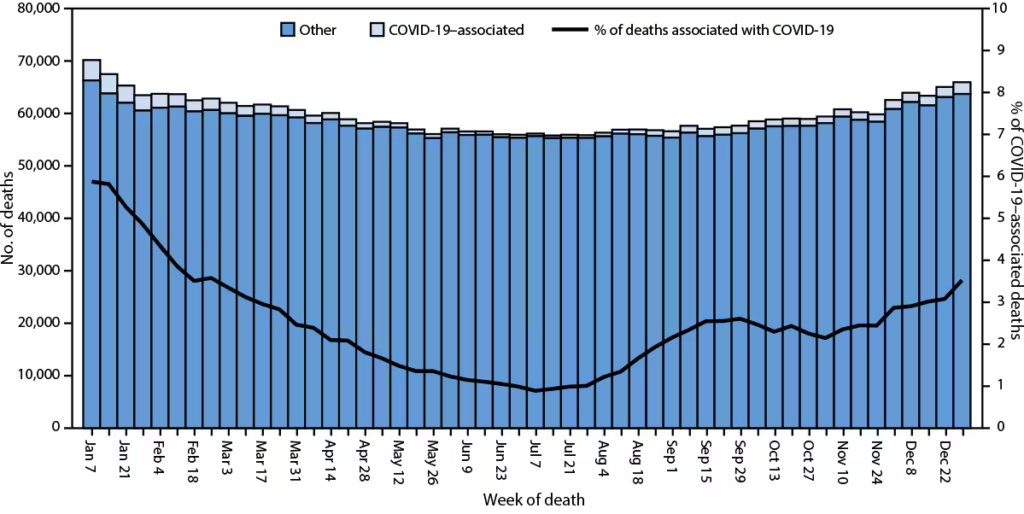
* National Vital Statistics System provisional data for 2023 are incomplete. Data from December 2023 are less complete because of reporting lags. These data exclude deaths that occurred in the United States among residents of U.S. territories and foreign countries.

 Deaths with confirmed or presumed COVID-19 as an underlying or contributing cause of death, with International Classification of Diseases, Tenth Revision code U07.1.

Excerpt:

Abstract

Final annual mortality data from the National Vital Statistics System for a given year are typically released 11 months after the end of the calendar year. Provisional data, which are based on preliminary death certificate data, provide an early estimate of deaths before the release of final data. In 2023, a provisional total of 3,090,582 deaths occurred in the United States. The age-adjusted death rate per 100,000 population was 884.2 among males and 632.8 among females; the overall rate, 750.4, was 6.1% lower than in 2022 (798.8). The overall rate decreased for all age groups. Overall age-adjusted death rates in 2023 were lowest among non-Hispanic multiracial (352.1) and highest among non-Hispanic Black or African American persons (924.3). The leading causes of death were heart disease, cancer, and unintentional injury. The number of deaths from COVID-19 (76,446) was 68.9% lower than in 2022 (245,614). Provisional death estimates provide an early signal about shifts in mortality trends. Timely and actionable data can guide public health policies and interventions for populations experiencing higher mortality.

Author(s): Farida B. Ahmad, MPH1; Jodi A. Cisewski, MPH1; Robert N. Anderson, PhD

Publication Date: 8 Aug 2024

Publication Site: CDC, MMWR Morbidity/Mortality Weekly Report

Suggested citation for this article: Ahmad FB, Cisewski JA, Anderson RN. Mortality in the United States — Provisional Data, 2023. MMWR Morb Mortal Wkly Rep 2024;73:677–681. DOI: http://dx.doi.org/10.15585/mmwr.mm7331a1

Drug Overdose Mortality by Usual Occupation and Industry: 46 U.S. States and New York City, 2020

Link: https://www.cdc.gov/nchs/data/nvsr/nvsr72/nvsr72-07.pdf

Graphic:

Excerpt:

Objective—This report describes deaths from drug overdoses in 2020 in U.S. residents in 46 states and New York City by usual occupation and industry. August 22, 2023

Conclusions—Variation in drug overdose death rates and PMRs by usual occupation and industry in 2020 demonstrates the disproportionate burden of the ongoing drug overdose crisis on certain sectors of the U.S. workforce.

Methods—Frequencies, death rates, and proportionate mortality ratios (PMRs) are presented using the 2020 National Vital Statistics System mortality data file. Data were restricted to decedents aged 16–64 for rates and 15–64 for PMRs with usual occupations and industries in the paid civilian workforce. Age-standardized drug overdose death rates were estimated for usual occupation and industry groups overall, and age-adjusted drug overdose PMRs were estimated for each usual occupation and industry group overall and by sex, race and Hispanic-origin group, type of drug, and drug overdose intent. Age-adjusted drug overdose PMRs were also estimated for individual occupations and industries.

Results—Drug overdose mortality varied by usual occupation and industry. Workers in the construction and extraction occupation group (162.6 deaths per 100,000 workers, 95% confidence interval: 155.8–169.4) and construction industry group (130.9, 126.0–135.8) had the highest drug overdose death rates. The highest group-level drug overdose PMRs were observed in decedents in the construction and extraction occupation group and the construction industry group (145.4, 143.6–147.1 and 144.9, 143.2–146.5, respectively). Differences in drug overdose PMRs by usual occupation and industry group were observed within each sex, within each race and Hispanicorigin group, by drug type, and by drug overdose intent. Among individual occupations and industries, the highest drug overdose PMRs were observed in decedents who worked as fishers and related fishing occupations and in fishing, hunting, and trapping industries (193.1, 166.8–222.4 and 186.5, 161.7–214.1, respectively).

Author(s): Billock RM, Steege AL, Miniño A.

Publication Date: August 22, 2023

Publication Site: CDC, National Vital Statistics System

Guidance for Certifying Deaths Due to Coronavirus Disease 2019 (COVID-19)

Link: https://www.cdc.gov/nchs/data/nvss/vsrg/vsrg03-508.pdf

Graphic:

Excerpt:

Certifying deaths due to post-acute sequelae of
COVID-19
In the acute phase, clinical manifestations and complications
of COVID-19 of varying degrees have been documented,
including death. However, patients who recover from the acute
phase of the infection can still suffer long-term effects (8).
Post-acute sequelae of COVID-19 (PASC), commonly referred
to as “long COVID,” refers to the long-term symptoms, signs,
and complications experienced by some patients who have
recovered from the acute phase of COVID-19 (8–10). Emerging
evidence suggests that severe acute respiratory syndrome
coronavirus 2 (SARS-CoV-2), the virus that causes COVID-19,
can have lasting effects on nearly every organ and organ system
of the body weeks, months, and potentially years after infection
(11,12). Documented serious post-COVID-19 conditions include
cardiovascular, pulmonary, neurological, renal, endocrine,
hematological, and gastrointestinal complications (8), as well as
death (13).

Consequently, when completing the death certificate, certifiers
should carefully review and consider the decedent’s medical
history and records, laboratory test results, and autopsy report,
if one is available. For decedents who had a previous SARSCoV-2 infection and were diagnosed with a post-COVID-19
condition, the certifier may consider the possibility that the death
was due to long-term complications of COVID-19, even if the
original infection occurred months or years before death. If it is
determined that PASC was the UCOD, it should be reported on
the lowest line used in Part I with the condition(s) it led to on the
line(s) above in a logical sequence in terms of time and etiology.
If it is determined that PASC was not the UCOD but was still a
significant condition that contributed to death, then it should be
reported in Part II. Certifiers should use standard terminology,
that is, “Post-acute sequelae of COVID-19.” See Scenario IV in
the Appendix for an example certification. In accordance with
all death certification guidance, if the certifier determines that
PASC did not cause or contribute to death, then they should not
report it anywhere on the death certificate.

Author(s): National Vital Statistics System, National Center for Health Statistics

Publication Date: updated 27 Feb 2023

Publication Site: CDC

Births: Provisional Data for 2021

Link: https://www.cdc.gov/nchs/data/vsrr/vsrr020.pdf

Graphic:

Excerpt:

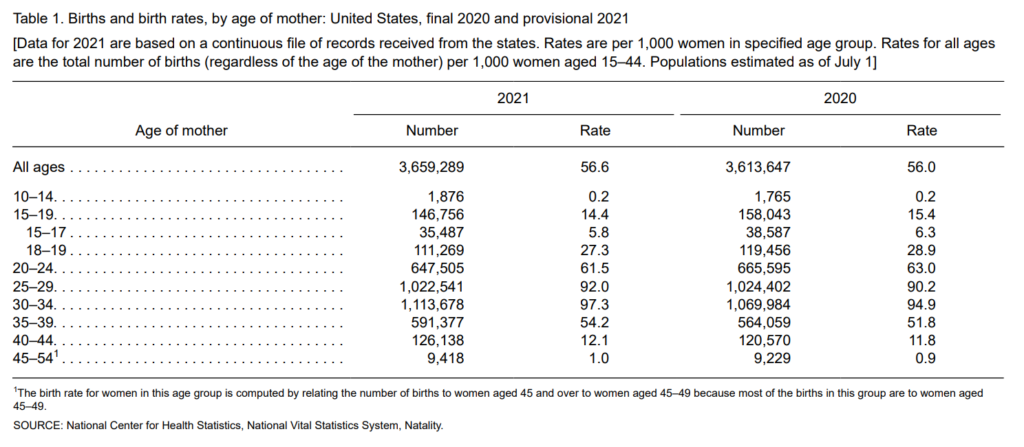
Methods—Data are based on 99.94% of all 2021 birth records received and processed by the National Center for Health Statistics as of February 10, 2022. Comparisons are made with final 2020 data and earlier years.

Results—The provisional number of births for the United States in 2021 was 3,659,289, up 1% from 2020 and the first increase in the number of births since 2014. The general fertility rate was 56.6 births per 1,000 women aged 15–44, up 1% from 2020 and the first increase in the rate since 2014. The total fertility
rate was 1,663.5 births per 1,000 women in 2021, up 1% from 2020. Birth rates declined for women in age groups 15–24, rose for women in age groups 25–49, and was unchanged for adolescents aged 10–14 in 2021. The birth rate for teenagers aged 15–19 declined by 6% in 2021 to 14.4 births per 1,000 females;
rates declined for both younger (aged 15–17) and older (aged 18–19) teenagers. The cesarean delivery rate rose to 32.1% in 2021; the low-risk cesarean delivery rate also rose to 26.3%. The preterm birth rate rose 4% in 2021 to 10.48%, the highest rate reported since 2007.

Author(s): Brady E. Hamilton, Ph.D., Joyce A. Martin, M.P.H., and Michelle J.K. Osterman, M.H.S.,
Division of Vital Statistics, National Center for Health Statistics

Publication Date: May 2022

Publication Site: CDC

The Spike in Drug Overdose Deaths During the COVID-19 Pandemic and Policy Options to Move Forward

Link: https://www.commonwealthfund.org/blog/2021/spike-drug-overdose-deaths-during-covid-19-pandemic-and-policy-options-move-forward

Graphic:

Excerpt:

The CDC’s National Vital Statistics System (NVSS) provides monthly provisional data on predicted total drug overdose deaths during the preceding 12 months. The most recent data reflect September 2019 through August 2020. During that period, there were 88,295 predicted deaths, a record high that is almost 19,000 more deaths (27%) than the prior 12-month period.

Using these predicted data in combination with final data from 2019, we estimated monthly overdose deaths from January to August 2020. Our estimates show that total overdose deaths spiked to record levels in March 2020 after the pandemic hit. Monthly deaths grew by about 50 percent between February and May to more than 9,000; they were likely still around 8,000 in August. Prior to 2020, U.S. monthly overdose deaths had never risen above 6,300.

Author(s): Jesse C. Baumgartner, David C. Radley

Publication Date: 25 March 2021

Publication Site: The Commonwealth Fund