Link: https://twitter.com/AlecStapp/status/1528859020098154496
Graphic:

Publication Date: 23 May 2022
Publication Site: Twitter
All about risk
Link: https://twitter.com/AlecStapp/status/1528859020098154496
Graphic:

Publication Date: 23 May 2022
Publication Site: Twitter
Link: https://www.jstor.org/stable/44633774
Graphic:

Abstract:
This study tested the hypothesis that seat belt usage is related to driver risk taking in car-following behavior. Individual vehicles on a Detroit area freeway were monitored to identify seat belt users and nonusers. Headways between successive vehicles in the traffic stream were also measured to provide a behavioral indicator of driver risk taking. Results showed that nonusers of seat belts tended to follow other vehicles closer than did users. Users were also less likely than nonusers to follow other vehicles at very short headways (one second or less). The implications of these findings for occupant safety in rear end collisions are discussed.
Author(s): Buseck, Calvin R. von, Leonard Evans, Donald E. Schmidt, and Paul Wasielewski
Publication Date: 1980
Publication Site: jstor, originally published in SAE Transactions, vol 89
Cite:
von Buseck, Calvin R., et al. “Seat Belt Usage and Risk Taking in Driving Behavior.” SAE Transactions, vol. 89, 1980, pp. 1529–33. JSTOR, http://www.jstor.org/stable/44633774. Accessed 21 May 2022.
Link: https://ctmirror.org/2022/04/18/why-driving-needs-to-feel-less-safe/
Excerpt:
Motor vehicle fatalities in Connecticut have risen dramatically since the pandemic, echoing a trend that we’ve seen across the country. About 300 people are killed annually on Connecticut’s streets by motor vehicles, and about 100 times as many people (roughly 30,000) suffer injuries severe ePnough to warrant hospital admission.
Nationally, these figures are roughly 40,000 deaths and 3.4 million injuries per year. The U.S. is an outlier among developed countries in the number of deaths that we tolerate on our roads, with a death rate 2 to 3 times that of similarly wealthy countries. The human cost of this carnage leaves no one untouched: almost everyone knows at least one person killed by a vehicle, not to mention millions of others who suffer from life-altering consequences like paralysis and traumatic brain injuries.
If we truly care about saving lives and preventing injuries, we need to change the mindset by which we view the act of driving.
Author(s): Dice Oh
Publication Date: 18 April 2022
Publication Site: CT Mirror
Link: https://marypatcampbell.substack.com/p/us-mortality-trends-through-the-pandemic?s=w
Video:
Graphic:
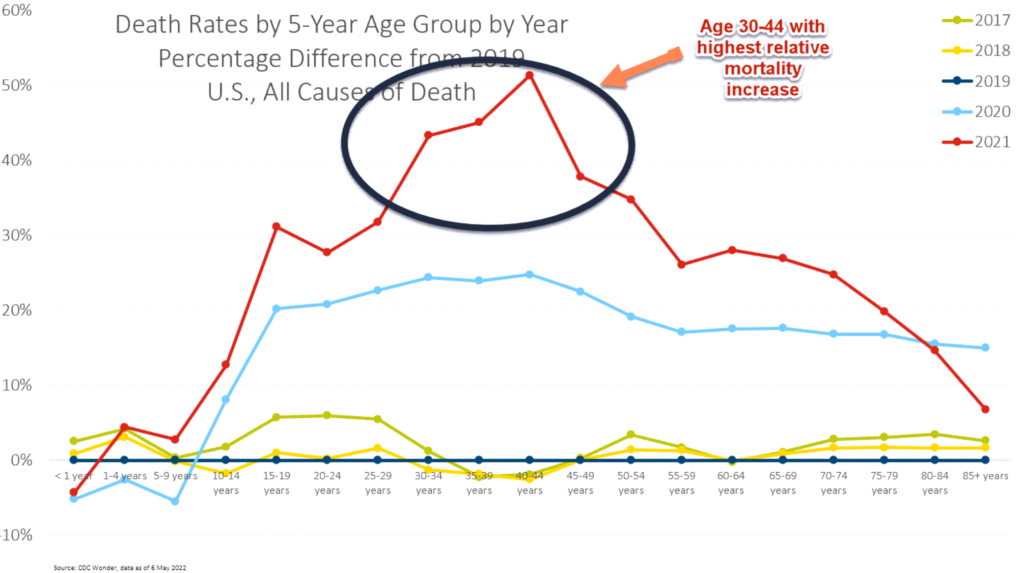
Excerpt:
I discuss this in the portion of the talk about death rates by age group.
For 2021, the worst relative increase in mortality, compared to 2019, was for ages 30-44.
[I have called it the Millennial Massacre, but it obviously overlaps with Gen X…. and Middle Age Massacre doesn’t exactly work, either. Dang the allure of alliteration].
We will see in a moment that most of that mortality increase didn’t come from COVID.
If you look at overall mortality, obviously total mortality for this age group is much lower than for those much older.
A 5% increase in mortality for those aged 85+ will translate to a much larger number of deaths, but a 50% increase in mortality for those aged 40-44 is extremely worrisome to actuaries and insurers even if the absolute number of deaths is lower in impact. We’re setting reserves and expectations based on certain assumptions, and we’re generally not assuming fluctuations of 50% — that’s just nuts compared to our historical experience…..
…..until now.
Author(s): Mary Pat Campbell
Publication Date: 20 May 2022
Publication Site: STUMP on substack
Link: https://marypatcampbell.substack.com/p/motor-vehicle-accident-deaths-part?s=w
Graphic:
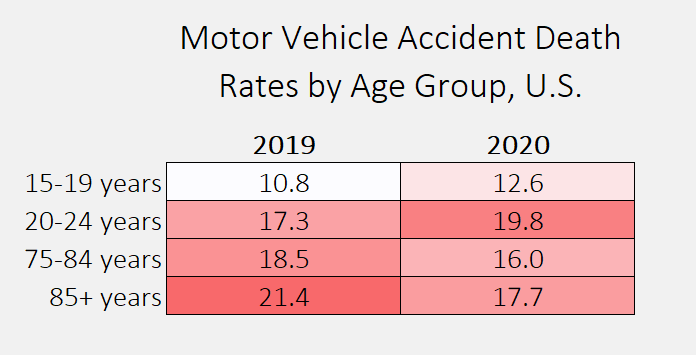
Excerpt:
The rates are per 100,000 people for the year, but the point is who has the highest, and we see that the answer is:
For 2019: age 85+
For 2020: age 20-24
I threw in the age 15-19 group as ringers, by the way. When we get to all the age groups, they’re not even #4 in the ranking.
Just in that little table, you can see that the rates went up for the youngsters and dropped for the seniors. Think about why that might be.
As noted in my polling question, I’m not adjusting for the number of miles driven, and I’m not going to dig for that data now. But would you like to make some assumptions about the driving habits of these different groups? Especially during the pandemic?
Author(s): Mary Pat Campbell
Publication Date: 2 March 2022
Publication Site: STUMP at substack
Link: https://www.dig-in.com/news/allstate-and-john-hancock-partner-safe-driving-telematics
Excerpt:
John Hancock and Allstate have announced a partnership to reward John Hancock Vitality members with points for safe driving. The partnership is the first of its kind, and comes in response to an increase in vehicle crash-related injuries. Customers will benefit from understanding how their choices, including driving behavior, impact their overall health, John Hancock believes.
….
The Vitality Program, which combines life insurance with education, incentives and rewards to help members lead healthier, longer lives, will allow members to submit proof of safe driving status in Allstate’s usage-based insurance program through a cashback reward email or by submitting a recent bill to show a safe-driving discount.
Motor vehicle deaths in the U.S. rose 18.4% in the first six months of 2021 over 2020, according to data from the U.S. Department of Transportation’s National Highway Traffic Safety Administration. An estimated 20,160 people died in motor vehicle crashes in the first half of 2021, the largest number of projected fatalities since the same period in 2006. Research into driving behavior from March 2020 through June 2021, shows that speeding and traveling without a seatbelt remain higher than pre-pandemic times, according to findings from NHTSA.
Author(s): Kaitlyn Mattson
Publication Date: 24 January 2022
Publication Site: Digital Insurance
Link: https://www.nytimes.com/2022/02/15/briefing/vehicle-crashes-deaths-pandemic.html
Graphic:
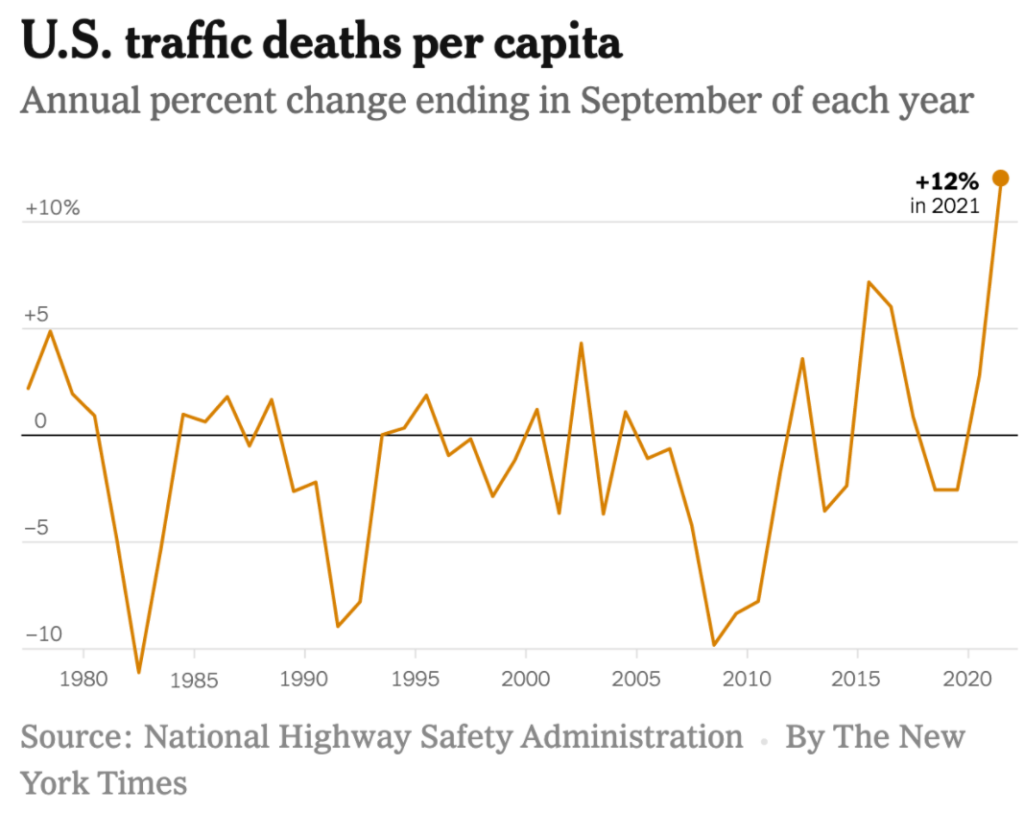
Excerpt:
Per capita vehicle deaths rose 17.5 percent from the summer of 2019 to last summer, according to a Times analysis of federal data. It is the largest two-year increase since just after World War II.
….
Rising drug abuse during the pandemic seems to play an important role, as well. The U.S. Department of Transportation has reported that “the proportion of drivers testing positive for opioids nearly doubled after mid-March 2020, compared to the previous 6 months, while marijuana prevalence increased by about 50 percent.” (Mid-March 2020 is when major Covid mitigations began.)
….
Vehicle crashes might seem like an equal-opportunity public health problem, spanning racial and economic groups. Americans use the same highways, after all, and everybody is vulnerable to serious accidents. But they are not equally vulnerable.
Traffic fatalities are much more common in low-income neighborhoods and among Native and Black Americans, government data shows. Fatalities are less common among Asian Americans. (The evidence about Latinos is mixed.) There are multiple reasons, including socioeconomic differences in vehicle quality, road conditions, substance abuse and availability of crosswalks.
Author(s): David Leonhardt
Publication Date: 15 Feb 2022
Publication Site: NYT
Excerpt:
The number of U.S. traffic deaths surged in the first nine months of 2021 to 31,720, the government reported Tuesday, keeping up a record pace of increased dangerous driving during the coronavirus pandemic.
The estimated figure of people dying in motor vehicle crashes from January to September 2021 was 12% higher than the same period in 2020. That represents the highest percentage increase over a nine-month period since the Transportation Department began recording fatal crash data in 1975.
The tally of 31,720 deaths was the highest nine-month figure since 2006.
Federal data from the department’s National Highway Traffic Safety Administration showed that traffic fatalities increased during the nine-month period in 38 states, led by those in the West and South such as Idaho, Nevada and Texas, and was flat in two states. The numbers declined in 10 states and the District of Columbia.
Author(s): Hope Yen
Publication Date: 1 Feb 2022
Publication Site: Associated Press
Excerpt:
In 2017, the governor of Utah enacted a law that lowered the legal blood alcohol concentration to .05 percent from the previous limit of .08 percent.
New research found that the law resulted in a nearly 20 percent reduction in fatal car crashes.
The Centers for Disease Control and Prevention estimates every day 29 people in the country die in motor vehicle crashes that involve an alcohol-impaired driver.
Author(s): Shirin Ali
Publication Date: 11 Feb 2022
Publication Site: The Hill
Link:https://www.nhtsa.gov/press-releases/traffic-fatalities-estimates-jan-sept-2021
PDF: https://crashstats.nhtsa.dot.gov/Api/Public/ViewPublication/813240
Graphic:
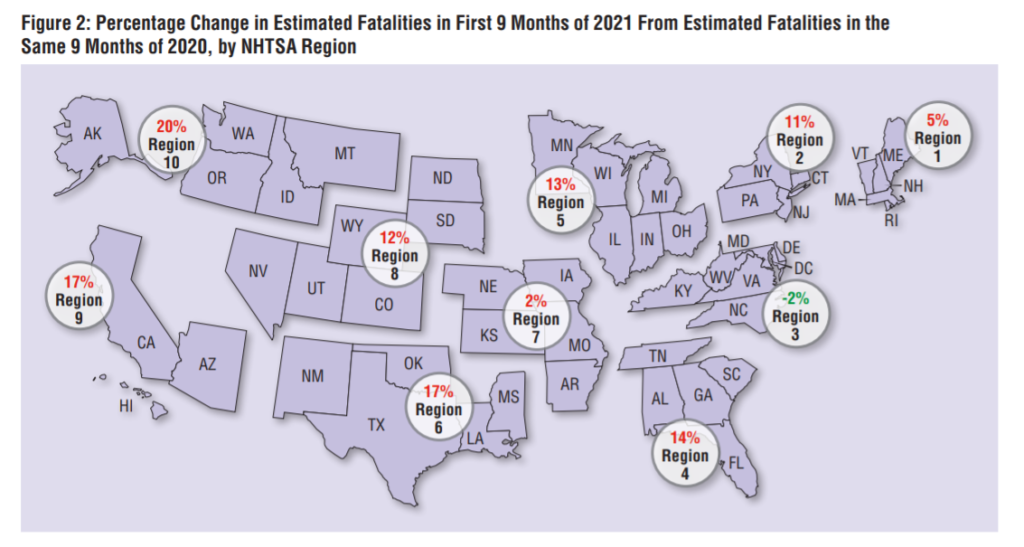
Excerpt:
The U.S. Department of Transportation’s National Highway Traffic Safety Administration released its early estimate of traffic fatalities for the first nine months of 2021.
NHTSA projects that an estimated 31,720 people died in motor vehicle traffic crashes from January through September 2021, an increase of approximately 12% from the 28,325 fatalities projected for the first nine months of 2020. The projection is the highest number of fatalities during the first nine months of any year since 2006 and the highest percentage increase during the first nine months in the Fatality Analysis Reporting System’s history.
The new estimates come days after the U.S. Department of Transportation released the federal government’s first-ever National Roadway Safety Strategy, a roadmap to address the national crisis in roadway fatalities and serious injuries.
Publication Date: 1 Feb 2022
Publication Site: NHTSA
Link: https://www.insurancejournal.com/news/midwest/2021/04/16/610222.htm
Excerpt:
The number of traffic crash fatalities in South Dakota rose to 141 last year — an increase of 38% over the previous year.
The South Dakota Department of Public Safety said in 2020, there were 132 crashes in which the fatalities occurred.
In 2019, 102 people were killed in motor vehicle crashes, the lowest in state history since records have been kept beginning in 1947. The number of fatal crashes in 2019 was 88, also a record low.
Publication Date: 16 April 2021
Publication Site: Insurance Journal
Graphic:
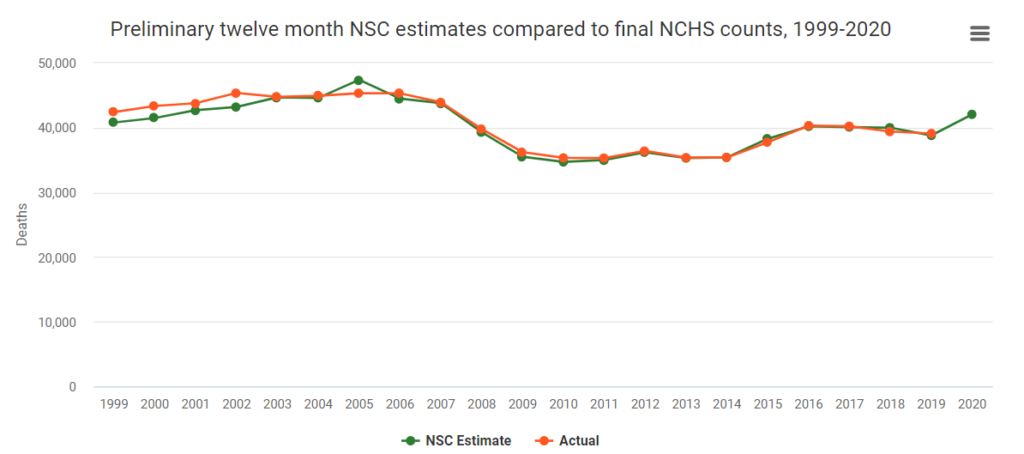
Excerpt:
The National Safety Council (NSC) estimate of total motor-vehicle deaths for 2020 is 42,060, up 8% from 39,107 in 2019. The estimated annual population death rate is 12.8 deaths per 100,000 population, up from 11.9 in 2019. The estimated mileage death rate is 1.49 deaths per 100 million vehicle miles traveled, up 24% from 1.20 in 2019. Estimated vehicle miles traveled for 2020 indicate over a 13% decrease compared to 2019, from 3,260 billion to 2,830 billion.
A medically consulted injury is an injury serious enough that a medical professional was consulted. Based on the current medically consulted injury-to-death ratio of 114:1, and rounded to the nearest thousand, the estimated number of nonfatal medically consulted injuries resulting from crashes during in 2020 was 4,795,000.
The estimated cost of motor-vehicle deaths, injuries, and property damage in 2020 was $474.4 billion.
Publication Date: 4 March 2021
Publication Site: National Safety Council