The Spanish flu: The global impact of the largest influenza pandemic in history

Link: https://ourworldindata.org/spanish-flu-largest-influenza-pandemic-in-history

Graphic:

Excerpt:

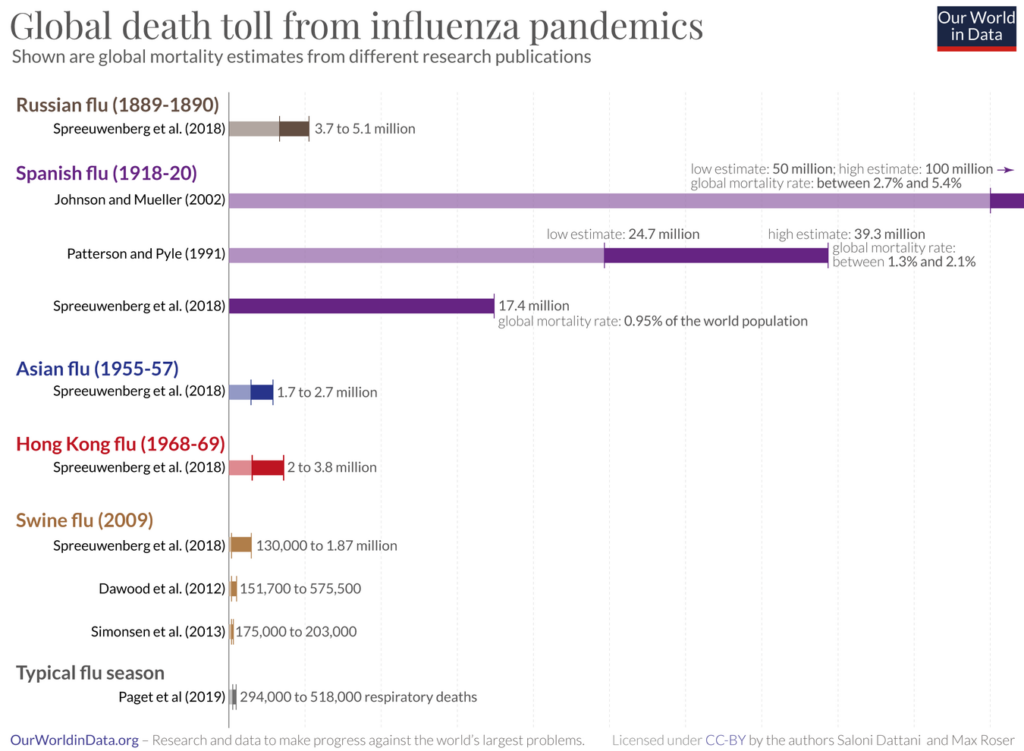
Estimates suggest that the world population in 1918 was 1.8 billion.

Based on this, the low estimate of 17.4 million deaths by Spreeuwenberg et al. (2018) implies that the Spanish flu killed almost 1% of the world population.9

The estimate of 50 million deaths published by Johnson and Mueller implies that the Spanish flu killed 2.7% of the world population. And if it was in fact higher – 100 million as these authors suggest – then the global death rate would have been 5.4%.10

The world population was growing by around 13 million every year in this period which suggests that the period of the Spanish flu was likely the last time in history when the world population was declining.11

Author(s): Max Roser

Publication Date: 4 Mar 202

Publication Site: Our World in Data

U.S. Population Mortality Observations – Updated with 2020 Experience

Link:https://www.soa.org/resources/research-reports/2022/us-population-mortality/

pdf: https://www.soa.org/globalassets/assets/files/resources/research-report/2022/population-mortality-observation.pdf

Graphic:

Excerpt:

The overall age-adjusted mortality rate (both sexes) from all causes of death recorded the historically highest increase of published records dating back to 1900 of 16.8% in 2020, following a 1.2% decrease in 2019. The increase eclipsed the size of recent years’ annual volatility and exceeded the 11.7% increase in
1918 that occurred during the Spanish influenza pandemic. When COVID deaths are removed, all other
CODs’ (Cause of Death) combined mortality increased by 4.9%, which was last exceeded by a 5.6% increase in 1936.

All other CODs featured in this report had increased 2020 mortality. In many instances, the single year
mortality increases were the largest for the span of this report. Heart disease and Alzheimer’s/Dementia
had 4.7% and 7.8% increases, respectively. Other physiological CODs with lower death rates had double-digit increases. Diabetes, liver and hypertension had increases of 14.9%, 16.0% and 13.3%, respectively.
The external CODs of assaults and opioid overdoses had extreme increases at ages 15-24 of 35.9% and
61.2%, respectively.

Author(s):

Jerome Holman, FSA, MAAA, RJH Integrated Solutions, LLC
Cynthia S. MacDonald, FSA, MAAA, Society of Actuaries Research Institute

Publication Date: Jan 2022

Publication Site: SOA

Top Causes of Death by Age Group, 2020: Death Rates

Link: https://marypatcampbell.substack.com/p/top-causes-of-death-by-age-group-0bf?justPublished=true

Graphic:

Excerpt:

I present the rates in percentages, as opposed to the more traditional number (which is per 100,000 people per year), because I do not want people to get this confused with the raw counts of people who died. Yes, that does mean there are a lot of small numbers. For children, I even had to extend some out to 4 decimal places to get a significant figure.

In adulthood, natural causes of death tend to increase in rate with increasing age. More below.

External causes (accidents, homicides, and suicide) will have the similar rates over broad ages but drop dramatically in ranking with increasing age — as the natural causes become more likely to occur.

COVID has a similar pattern in mortality as heart disease — indeed, the heart disease death rate is approximately twice that of the COVID death rate for the entire age range from 15 to 85+ on the table.

Author(s): Mary Pat Campbell

Publication Date: 22 Jan 2022

Publication Site: STUMP at substack