Rise Of The Insurance Apocalypse

Link: https://www.levernews.com/rise-of-the-insurance-apocalypse/

Excerpt:

Most insurance companies at that time assessed hurricane exposure in their portfolios by simply multiplying customer premiums by a rough factor of supposed risk, rather than tracking actual property replacement costs. “They were just very crude formulas,” she said. 

So in 1987, Clark had started her own company, Applied Insurance Research, or AIR, to develop software that better estimated the potential losses from catastrophic events. Unlike the rest of the industry, she used granular data and sophisticated analyses, an approach now called catastrophe modeling. Her first computer model estimated that a Category 5 hurricane hitting Dade County could cause losses almost 10 times more than previously believed. She warned her customers about the risk in Florida, but until Hurricane Andrew, no one listened. 

Author(s): Lois Parshley

Publication Date: 23 Sept 2024

Publication Site: The Lever

Report Highlights Public Health Impact of Serious Harms From Diagnostic Error in U.S.

Link:https://www.hopkinsmedicine.org/news/newsroom/news-releases/report-highlights-public-health-impact-of-serious-harms-from-diagnostic-error-in-us#:~:text=Results%20of%20the%20new%20analysis,of%20the%20public%20health%20problem.

Excerpt:

Improving diagnosis in health care is a moral, professional and public health imperative, according to the U.S. National Academy of Medicine. However, little is known about the full scope of harms related to medical misdiagnosis — current estimates range widely. Using novel methods, a team from the Johns Hopkins Armstrong Institute Center for Diagnostic Excellence and partners from the Risk Management Foundation of the Harvard Medical Institutions sought to derive what is believed to be the first rigorous national estimate of permanent disability and death from diagnostic error.  

The original research article was published July 17 by BMJ Quality & Safety. Results of the new analysis of national data found that across all clinical settings, including hospital and clinic-based care, an estimated 795,000 Americans die or are permanently disabled by diagnostic error each year, confirming the pressing nature of the public health problem.  

….

To identify their findings, researchers multiplied national measures of disease incidence by the disease-specific proportion of patients with that illness who experience errors or harms. Researchers repeated this method for the 15 diseases causing the most harms, then extrapolated to the grand total across all dangerous diseases. To assess the accuracy of the final estimates, the study’s authors ran the analyses under different sets of assumptions to measure the impact of methodological choices and then tested the validity of findings by comparing them with independent data sources and expert review. The resulting national estimate of 371,000 deaths and 424,000 permanent disabilities reflects serious harms widely across care settings, and it matches data produced from multiple prior studies that focused on diagnostic errors in ambulatory clinics and emergency departments and during inpatient care.  

Vascular events, infections and cancers, dubbed the Big Three, account for 75% of the serious harms. The study found that 15 diseases account for 50.7% of the total serious harms. Five conditions causing the most frequent serious harms account for 38.7% of total serious harms: stroke, sepsis, pneumonia, venous thromboembolism and lung cancer. The overall average error rate across diseases was estimated at 11.1%, but the rate ranges widely from 1.5% for heart attack to 62% for spinal abscess. The top cause of serious harm from misdiagnosis was stroke, which was found to be missed in 17.5% of cases.  

Author(s):  David Newman-Toker 

Publication Date: 17 July 2023

Publication Site: Johns Hopkins, press release

Mortality and the provision of retirement income

Link: https://www.oecd.org/daf/fin/private-pensions/launch-publication-mortality-provision-retirement.htm

Graphic:

Video:

Excerpt:

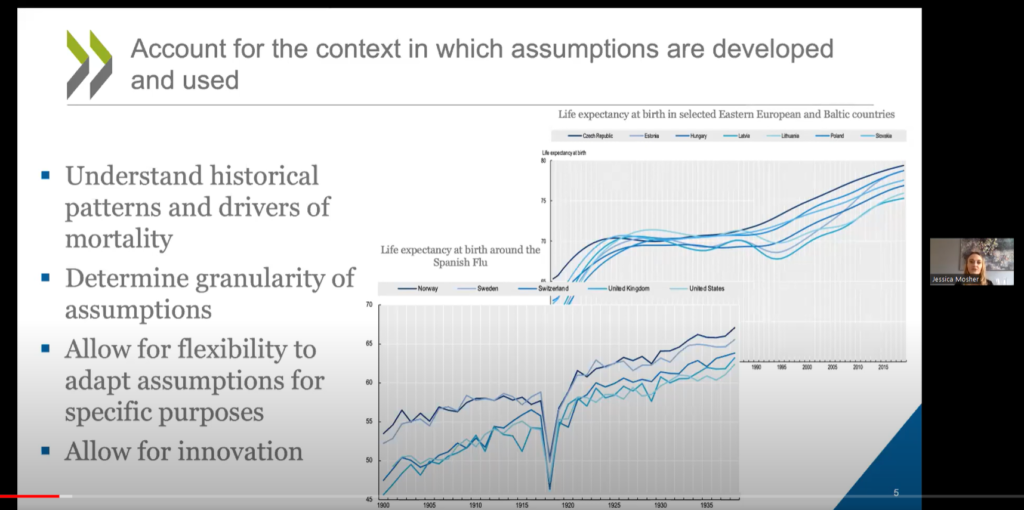
The report analyses the development of mortality assumptions to build mortality tables to better protect retirement income provision. It first provides an international overview of longevity trends and drivers over the last several decades, including the impact of the COVID-19 pandemic. It then explores considerations and traditional approaches for developing mortality tables, and details the standard mortality tables developed across OECD member countries. It concludes with guidelines to assist regulators and supervisors in assessing whether the mortality assumptions and tables used in the context of retirement income provision are appropriate.

The OECD will provide an overview of the publication, followed by a roundtable discussion with government and industry stakeholders. Topics discussed will include:

  • Recent mortality trends and drivers
  • How mortality trends/drivers can inform future expectations, and how to account for that in modelling
  • The challenge of accounting for COVID in setting mortality assumptions
  • Trade-offs for different modelling approaches
  • The usefulness of the guidelines included in the report in practice
  • How to better communicate around mortality assumptions to non-experts

Publication Date: 2 Feb 2023

Publication Site: OECD

Coordinating VM-31 With ASOP No. 56 Modeling

Link: https://www.soa.org/sections/financial-reporting/financial-reporting-newsletter/2022/july/fr-2022-07-rudolph/

Excerpt:

In the PBRAR, VM-31 3.D.2.e.(iv) requires the actuary to discuss “which risks, if any, are not included in the model” and 3.D.2.e.(v) requires a discussion of “any limitations of the model that could materially impact the NPR [net premium reserve], DR [deterministic reserve] or SR [stochastic reserve].” ASOP No. 56 Section 3.2 states that, when expressing an opinion on or communicating results of the model, the actuary should understand: (a) important aspects of the model being used, including its basic operations, dependencies, and sensitivities; (b) known weaknesses in assumptions used as input and known weaknesses in methods or other known limitations of the model that have material implications; and (c) limitations of data or information, time constraints, or other practical considerations that could materially impact the model’s ability to meet its intended purpose.

Together, both VM-31 and ASOP No. 56 require the actuary (i.e., any actuary working with or responsible for the model and its output) to not only know and understand but communicate these limitations to stakeholders. An example of this may be reinsurance modeling. A common technique in modeling the many treaties of yearly renewable term (YRT) reinsurance of a given cohort of policies is to use a simplification, where YRT premium rates are blended according to a weighted average of net amounts at risk. That is to say, the treaties are not modeled seriatim but as an aggregate or blended treaty applicable to amounts in excess of retention. This approach assumes each third-party reinsurer is as solvent as the next. The actuary must ask, “Is there a risk that is ignored by the model because of the approach to modeling YRT reinsurance?” and “Does this simplification present a limitation that could materially impact the net premium reserve, deterministic reserve or stochastic reserve?”

Understanding limitations of a model requires understanding the end-to-end process that moves from data and assumptions to results and analysis. The extract-transform-load (ETL) process actually fits well with the ASOP No. 56 definition of a model, which is: “A model consists of three components: an information input component, which delivers data and assumptions to the model; a processing component, which transforms input into output; and a results component, which translates the output into useful business information.” Many actuaries work with models on a daily basis, yet it helps to revisit this important definition. Many would not recognize the routine step of accessing the policy level data necessary to create an in-force file as part of the model itself. The actuary should ask, “Are there risks introduced by the frontend or backend processing in the ETL routine?” and “What mitigations has the company established over time to address these risks?”

Author(s): Karen K. Rudolph

Publication Date: July 2022

Publication Site: SOA Financial Reporter

Top Excel experts will battle it out in an esports-like competition this weekend

Link:https://www.pcworld.com/article/559001/the-future-of-esports-is-microsoft-excel-and-its-on-espn.html

Graphic:

Excerpt:

Move over, League of Legends. Does anyone even care about Overwatch? No, the real future of esports is spreadsheets and Microsoft Excel. Don’t believe us? Then tune in to ESPN3 or YouTube this weekend to find out.

No, this isn’t a joke. The Financial Modeling World Cup will be held this weekend entirely in Microsoft Excel. And the finals (the quarterfinals, semifinals, and the final match) will all be broadcast live as they happen at 9 AM PT. Everyone’s playing for a total prize of $10,000 — funded by Microsoft, of course.

Author(s):Mark Hachman

Publication Date: 10 Dec 2021

Publication Site: PC World

COVID-19 Scenario Modeling Hub: Projections

Link:https://covid19scenariomodelinghub.org/viz.html

Graphic:

Excerpt:

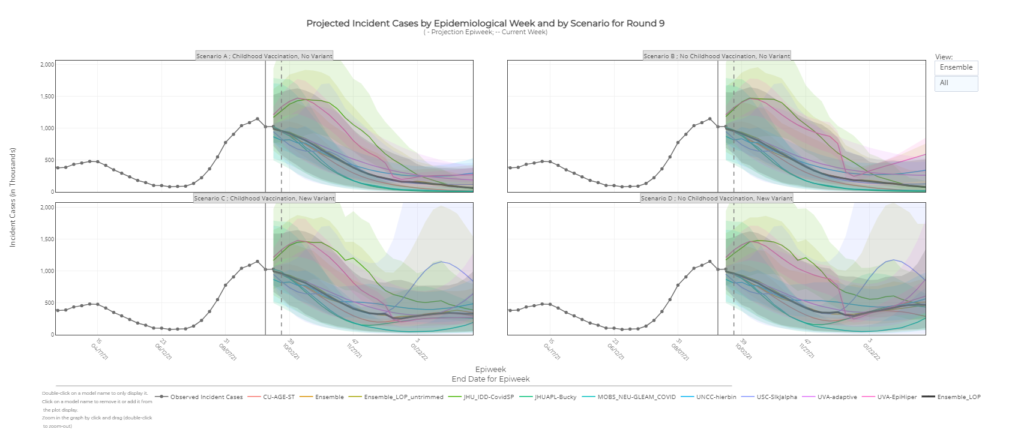
Definitions

NPI: NonPharmaceutical Interventions (e.g. masks, social distancing)
Epiweek: Epidemiological Week as defined by MMWR
LOP: Linear Opinion Pool; method used to calculate Ensemble_LOP and Ensemble_LOP_untrimmed by averaging cumulative probabilities of a given value across submissions. See Notes for more details.

Publication Date: Accessed 24 Sept 2021

Publication Site: COVID-19 Scenario Modeling Hub

Has the Pandemic Finally Peaked in the U.S.?

Link: https://reason.com/2021/09/23/has-the-pandemic-finally-peaked-in-the-u-s/?utm_medium=email

Graphic:

Excerpt:

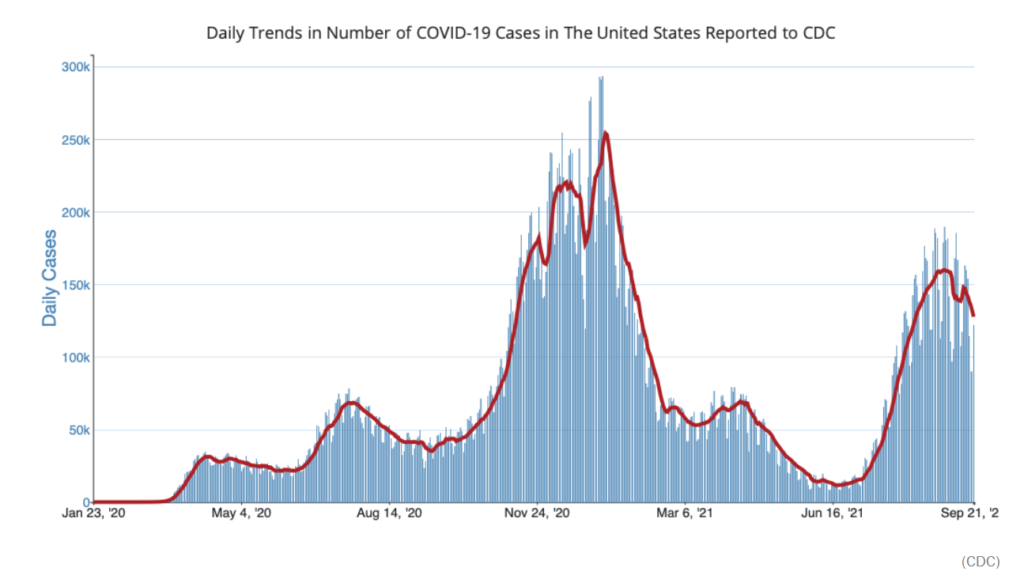
Will COVID-19 cases and deaths surge again this winter? The combined just-released results of 9 models applied to four different scenarios at COVID-19 Modeling Hub project that diagnosed cases could—using the projections of the more hopeful models—drop to around 9,000 cases per day by March. The scenarios range from the most hopeful, with childhood COVID-19 vaccinations and no new viral variant, to one with no child vaccinations and a new variant.

……

University of North Carolina epidemiologist Justin Lessler, who helps run the hub, tells NPR that the most likely scenario is that children do get vaccinated and no super-spreading variant emerges.

The good news is that about 55 percent of all Americans (181 million) are now fully vaccinated (64 percent of those age 12 and up). Given that unreported COVID-19 cases are generally thought to be considerably higher than the 42 million diagnosed cases, that suggests perhaps around 100 million Americans have developed natural immunity to the virus.

Author(s): Ronald Bailey

Publication Date: 23 Sept 2021

Publication Site: Reason

Intro to Financial Modelling – Part 19: Wrap-up

Link: https://www.icaew.com/technical/technology/excel/excel-community/excel-community-articles/2021/intro-to-financial-modelling-part-19

Graphic:

Excerpt:

There has been significant disruption in how organisations conduct business and the way we work over the past year and a half. However, financial modellers and developers have had to continue to build, refine and test their models throughout these unprecedented times. Figure 1 below summarises the areas we have covered in the blog series and how they fit together to form the practical guidance of how to follow and implement the Financial Modelling Code.

Author(s): Andrew Paw

Publication Date: 19 August 2021

Publication Site: ICAEW

12 strategies to uncover any wrongs inside

Graphic:

Excerpt:

Look for nonlinearities

Not all 10% increases are created equal. And by that we mean, assumption effects are often more impactful in one direction than in the other. Especially when it comes to truncation models or those which use a CTE measure (conditional tail expectation).

Principles-based reserves, for example, use a CTE70 measure. [Take the average of the (100% – 70% = 30%) of the scenarios.] If your model increases expense 3% across the board, sure, on average, your asset funding need might increase by exactly that amount. However, because your final measurement isn’t the average across all the scenarios, but only the worst ones, it’s likely that your reserve amounts are going to increase by significantly more than the average. You might need to run a few different tests, at various magnitudes of change, to determine how your various outputs change as a function of the volatility of your inputs.

Publication Date: 14 July 2021

Publication Site: SLOPE – Actuarial Modeling Software

Keep Up With the Standards: On ASOP 56, Modeling

Link: https://www.soa.org/sections/modeling/modeling-newsletter/2021/april/mp-2021-04-campbell/

Excerpt:


If nothing else, having a checklist to go through while working on modeling can help you make sure you don’t miss anything. Hey, ASB, make some handy-dandy sticky note checklists we can stick on our monitors to ask us:

3.1 Does our model meet the intended purpose?

3.2 Do we understand the model, especially any weaknesses and limitations?

3.3 Are we relying on data or other information supplied by others?

3.4 Are we relying on models developed by others?

3.5 Are we relying on experts in the development of the model?

3.6 Have we evaluated and mitigated model risk?

3.7 Have we appropriately documented the model?

Author(s): Mary Pat Campbell

Publication Date: April 2021

Publication Site: The Modeling Platform at the Society of Actuaries

Ahead of the curve: Modelling the unmodellable

Link: https://www.ipe.com/home/ahead-of-the-curve-modelling-the-unmodellable/10051869.article

Graphic:

Excerpt:

In his youth, the economist Kenneth Arrow analysed weather forecasts for the US Army. When he found that the predictions were as reliable as historical averages, he suggested reallocating manpower. The response from the army general’s office? “The general is well aware that your division’s forecasts are worthless. However, they are required for planning purposes.”

Even before COVID-19, many shared that scepticism of forecasts. The failure to foresee the 2008-09 financial crisis started a debate on economic modelling. Over the past year, the performance of epidemiological models has not resolved this quandary.

Investors have long known that “all models are wrong, but some are useful,” to use the statistician George Box’s pithy idiom. But, there are modellers who use this defence to preserve models beyond usefulness. Meanwhile, there are unrealistic expectations from consumers of models including investors, policymakers and society. They assume that complex issues are easy to forecast, when some things are just unknowable. This gap begs the question of what investors should do.

Author(s): Sahil Mahtani

Publication Date: April 2021

Publication Site: Investments & Pensions Europe

Forecasters Predict COVID-19 Case Counts Will Keep Falling

Link: https://www.thinkadvisor.com/2021/03/04/forecasters-predict-covid-19-case-counts-will-keep-falling/

Excerpt:

Forecasters are predicting that U.S. COVID-19 case counts and the U.S. COVID-19 death numbers will continue to improve over the next four weeks.

Most of the forecasters in the COVID-19 Forecast Hub system say weekly new case counts will be somewhere between 350,000 and 450,000 over the next four weeks, compared with an actual number of about 477,000 recorded during the week that ended March 1.

The forecasters are predicting the number of deaths per week will fall to about 6,000 to 8,000, from about 14,000 per week, over that same four-week period.

Author(s): Allison Bell

Publication Date: 4 March 2021

Publication Site: Think Advisor