Is Social Security’s Website Suddenly Saying the System Owes You Far Less?

Link: https://www.forbes.com/sites/kotlikoff/2023/10/20/is-social-securitys-website-suddenly-saying-it-owes-you-far-less/?sh=e3603bc7f679

Graphic:

Excerpt:

Social Security states, at this link: retirement/planner/AnypiaApplet.html, that “(Its) Online Calculator is updated periodically with new benefit increases and other benefit amounts. Therefore, it is likely that your benefit estimates in the future will differ from those calculated today.” It also says that the most recent update was in August 2023.

This statement references Social Security’s Online Calculator. But they have a number of calculators that make different assumptions. And it’s not clear what calculator they used to produce the graphic, see below, that projects your future retirement benefit conditional on working up to particular dates and then collecting immediately. Nor is Social Security making clear what changes they are making to their calculators through time.

What I’m quite sure is true is that the code underlying Social Security’s graphic projects your future earnings at their current nominal value. This is simply nuts. Imagine you are age 40 and will work till age 67 and take your benefits then. If inflation over the next 27 years is 27 percent, your real earnings are being projected to decline by 65 percent! This is completely unrealistic and makes the chart, if my understanding is correct, useless.

….

The only thing that might, to my knowledge, reduce projected future future benefits over the course of the past four months is a reduction in Social Security’s projected future bend point values in its PIA (Primary Insurance Amount) formula. This could lead to lower projected future benefits for those pushed higher PIA brackets, which would mean reduced benefit brackets. This could also explain why the differences in projections vary by person.

….

Millions of workers are being told, from essentially one day to the next, that their future real Social Security income will be dramatically lower. Furthermore, the assumption underlying this basic chart — that your nominal wages will never adjust for inflation — means that for Social Security’s future benefit estimate is ridiculous regardless of what it’s assuming under the hood about future bend points.

….

One possibility here is that a software engineer has made a big coding mistake. This happens. On February 23, 2022, I reported in Forbes that Social Security had transmitted, to unknown millions of workers, future retirement benefits statements that were terribly wrong. The statement emailed to me by a worker, which I copy in my column, specified essentially the same retirement benefit at age 62 as at full retirement age. It also specified a higher benefit for taking benefits several few months before full retirement.

Anyone familiar with Social Security benefit calculations would instantly conclude that there was either a major bug in the code or that that, heaven forbid, the system had been hacked. But if this wasn’t a hack, why would anyone have changed code that Social Security claimed, for years, was working correctly? Social Security made no public comment in response to my prior column. But it fixed its code as I suddenly stopped receiving crazy benefit statements.

Author(s): Laurence Kotlikoff

Publication Date: 20 Oct 2023

Publication Site: Forbes
The insurance industry’s renewed focus on disparate impacts and unfair discrimination

Link: https://www.milliman.com/en/insight/the-insurance-industrys-renewed-focus-on-disparate-impacts-and-unfair-discrimination

Excerpt:

As consumers, regulators, and stakeholders demand more transparency and accountability with respect to how insurers’ business practices contribute to potential systemic societal inequities, insurers will need to adapt. One way insurers can do this is by conducting disparate impact analyses and establishing robust systems for monitoring and minimizing disparate impacts. There are several reasons why this is beneficial:

  1. Disparate impact analyses focus on identifying unintentional discrimination resulting in disproportionate impacts on protected classes. This potentially creates a higher standard than evaluating unfairly discriminatory practices depending on one’s interpretation of what constitutes unfair discrimination. Practices that do not result in disparate impacts are likely by default to also not be unfairly discriminatory (assuming that there are also no intentionally discriminatory practices in place and that all unfairly discriminatory variables codified by state statutes are evaluated in the disparate impact analysis).
  2. Disparate impact analyses that align with company values and mission statements reaffirm commitments to ensuring equity in the insurance industry. This provides goodwill to consumers and provides value to stakeholders.
  3. Disparate impact analyses can prevent or mitigate future legal issues. By proactively monitoring and minimizing disparate impacts, companies can reduce the likelihood of allegations of discrimination against a protected class and corresponding litigation.
  4. If writing business in Colorado, then establishing a framework for assessing and monitoring disparate impacts now will allow for a smooth transition once the Colorado bill goes into effect. If disparate impacts are identified, insurers have time to implement corrections before the bill is effective.

Author(s): Eric P. Krafcheck

Publication Date: 27 Sept 2021

Publication Site: Milliman

Coordinating VM-31 With ASOP No. 56 Modeling

Link: https://www.soa.org/sections/financial-reporting/financial-reporting-newsletter/2022/july/fr-2022-07-rudolph/

Excerpt:

In the PBRAR, VM-31 3.D.2.e.(iv) requires the actuary to discuss “which risks, if any, are not included in the model” and 3.D.2.e.(v) requires a discussion of “any limitations of the model that could materially impact the NPR [net premium reserve], DR [deterministic reserve] or SR [stochastic reserve].” ASOP No. 56 Section 3.2 states that, when expressing an opinion on or communicating results of the model, the actuary should understand: (a) important aspects of the model being used, including its basic operations, dependencies, and sensitivities; (b) known weaknesses in assumptions used as input and known weaknesses in methods or other known limitations of the model that have material implications; and (c) limitations of data or information, time constraints, or other practical considerations that could materially impact the model’s ability to meet its intended purpose.

Together, both VM-31 and ASOP No. 56 require the actuary (i.e., any actuary working with or responsible for the model and its output) to not only know and understand but communicate these limitations to stakeholders. An example of this may be reinsurance modeling. A common technique in modeling the many treaties of yearly renewable term (YRT) reinsurance of a given cohort of policies is to use a simplification, where YRT premium rates are blended according to a weighted average of net amounts at risk. That is to say, the treaties are not modeled seriatim but as an aggregate or blended treaty applicable to amounts in excess of retention. This approach assumes each third-party reinsurer is as solvent as the next. The actuary must ask, “Is there a risk that is ignored by the model because of the approach to modeling YRT reinsurance?” and “Does this simplification present a limitation that could materially impact the net premium reserve, deterministic reserve or stochastic reserve?”

Understanding limitations of a model requires understanding the end-to-end process that moves from data and assumptions to results and analysis. The extract-transform-load (ETL) process actually fits well with the ASOP No. 56 definition of a model, which is: “A model consists of three components: an information input component, which delivers data and assumptions to the model; a processing component, which transforms input into output; and a results component, which translates the output into useful business information.” Many actuaries work with models on a daily basis, yet it helps to revisit this important definition. Many would not recognize the routine step of accessing the policy level data necessary to create an in-force file as part of the model itself. The actuary should ask, “Are there risks introduced by the frontend or backend processing in the ETL routine?” and “What mitigations has the company established over time to address these risks?”

Author(s): Karen K. Rudolph

Publication Date: July 2022

Publication Site: SOA Financial Reporter

Climate Scientists Encounter Limits of Computer Models, Bedeviling Policy

Link:https://www.wsj.com/articles/climate-change-global-warming-computer-model-11642191155?mod=hp_lead_pos10

Excerpt:

At least 20 older climate models disagreed with the new one at NCAR, an open-source model called the Community Earth System Model 2, or CESM2, funded mainly by the U.S. National Science Foundation and arguably the world’s most influential. Then, one by one, a dozen climate-modeling groups around the world produced similar forecasts.

The scientists soon concluded their new calculations had been thrown off kilter by the physics of clouds in a warming world, which may amplify or damp climate change. “The old way is just wrong, we know that,” said Andrew Gettelman, a physicist at NCAR who specializes in clouds and helped develop the CESM2 model. “I think our higher sensitivity is wrong too. It’s probably a consequence of other things we did by making clouds better and more realistic. You solve one problem and create another.”

Since then the CESM2 scientists have been reworking their algorithms using a deluge of new information about the effects of rising temperatures to better understand the physics at work. They have abandoned their most extreme calculations of climate sensitivity, but their more recent projections of future global warming are still dire — and still in flux.

…..

Skeptics have scoffed at climate models for decades, saying they overstate hazards. But a growing body of research shows many climate models have been uncannily accurate. For one recent study, scientists at NASA, the Breakthrough Institute in Berkeley, Calif., and the Massachusetts Institute of Technology evaluated 17 models used between 1970 and 2007 and found most predicted climate shifts were “indistinguishable from what actually occurred.”

Still, models remain prone to technical glitches and are hampered by an incomplete understanding of the variables that control how our planet responds to heat-trapping gases.

Author(s): Robert Lee Hotz

Publication Date: 6 Feb 2022

Publication Site: WSJ

The catastrophe of the Covid models

Link:https://www.spiked-online.com/2022/01/21/the-catastrophe-of-the-covid-models/

Graphic:

Excerpt:

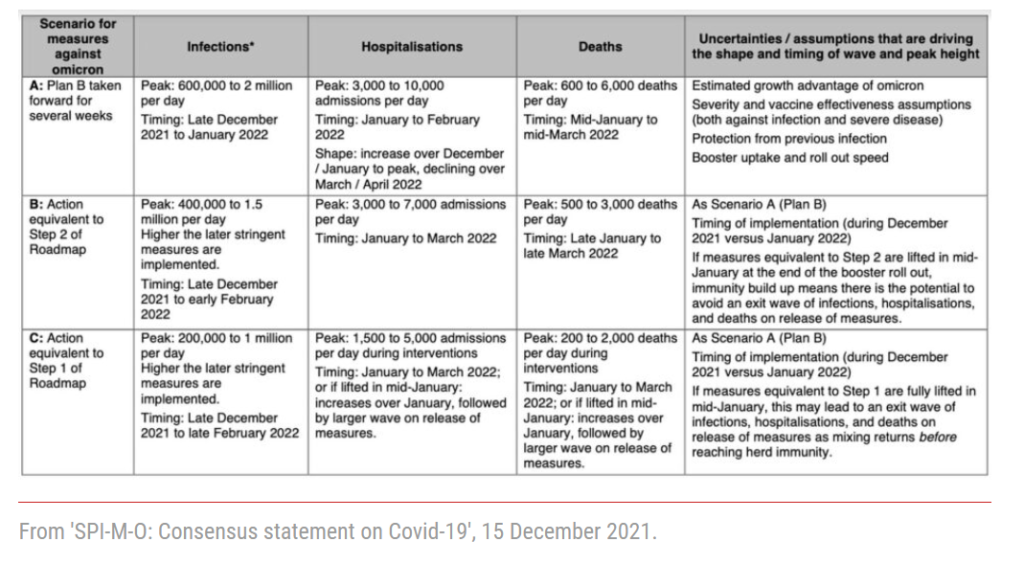
Having taken all the modelling into account, SAGE produced a table that showed in stark terms what the future held if the government stuck to ‘Plan B’. With the usual risible caveat that ‘these are not forecasts or predictions’, they showed a peak in hospitalisations of between 3,000 and 10,000 per day and a peak in deaths of between 600 and 6,000 a day. In previous waves, without any vaccines, deaths had never exceeded 1,250 a day.

The government was effectively given an ultimatum. SAGE offered Johnson a choice between the disaster that would surely unfold and a ‘Step 1’ or ‘Step 2’ lockdown, both of which had been helpfully modelled to give him a steer. ‘Step 1’ was a full lockdown as implemented last January. ‘Step 2’ allowed limited contact with other households but only outdoors.

In the event, as we all know, Boris Johnson ignored the warnings and declined to implement any new restrictions on liberty. A few days later, Robert West, a nicotine-addiction specialist who is on SAGE for some reason, tweeted: ‘It is now a near certainty that the UK will be seeing a hospitalisation rate that massively exceeds the capacity of the NHS. Many thousands of people have been condemned to death by the Conservative government.’

It did not quite turn out that way. Covid-related hospitalisations in England peaked at 2,370 on 29 December and it looks like the number of deaths will peak well below 300. This is not just less than was projected under ‘Plan B’, it is less than was projected under a ‘Step 2’ lockdown. The modelling for ‘Step 2’ showed a peak of at least 3,000 hospitalisations and 500 deaths a day. SAGE had given itself an enormous margin of error. There is an order of magnitude between 600 deaths a day and 6,000 deaths a day and yet it still managed to miss the mark.

Author(s): Christopher Snowdon

Publication Date: 22 Jan 2022

Publication Site: Spiked Online

Judge narrows SEC bond rating lawsuit against Morningstar

Link: https://www.businessinsurance.com/article/20220106/NEWS06/912347036/Judge-narrows-SEC-bond-rating-lawsuit-against-Morningstar,-SEC-v-Morningstar-Cre

Excerpt:

A U.S. judge on Wednesday narrowed but refused to dismiss a Securities and Exchange Commission lawsuit accusing Morningstar Inc. of letting analysts adjust credit rating models for about $30 billion of mortgage securities, resulting in lower payouts to investors.

U.S. District Judge Ronnie Abrams in Manhattan said the SEC plausibly alleged that Morningstar Credit Ratings failed to provide users with a general understanding of its methodology for rating commercial mortgage-backed securities and lacked effective internal controls over its ratings process.

Author(s): Reuters

Publication Date: 6 Jan 2022

Publication Site: Business Insurance

12 strategies to uncover any wrongs inside

Graphic:

Excerpt:

Look for nonlinearities

Not all 10% increases are created equal. And by that we mean, assumption effects are often more impactful in one direction than in the other. Especially when it comes to truncation models or those which use a CTE measure (conditional tail expectation).

Principles-based reserves, for example, use a CTE70 measure. [Take the average of the (100% – 70% = 30%) of the scenarios.] If your model increases expense 3% across the board, sure, on average, your asset funding need might increase by exactly that amount. However, because your final measurement isn’t the average across all the scenarios, but only the worst ones, it’s likely that your reserve amounts are going to increase by significantly more than the average. You might need to run a few different tests, at various magnitudes of change, to determine how your various outputs change as a function of the volatility of your inputs.

Publication Date: 14 July 2021

Publication Site: SLOPE – Actuarial Modeling Software

How the UK’s Covid reopening has proved Imperial’s pessimistic modelling wrong

Link: https://www.telegraph.co.uk/news/2021/05/04/uks-covid-reopening-has-proved-imperials-pessimistic-modelling/

Excerpt:

It is a wonder that nobody choked on their morning toast and tea, for if Imperial modelling has stood for anything in this crisis, it is relentless pessimism. Plummeting figures were certainly not predicted by its researchers. The difference this time is that the Government has pressed ahead with reopening despite the doom-mongering, and so has proven the models wrong.

Here is what they said would happen and what we know now: Hospital admissions When the Government published its roadmap out of the pandemic on Feb 22, it was largely based on modelling assumptions from Imperial, the London School of Hygiene & Tropical Medicine and Warwick University.

Imperial modelled four unlocking scenarios, ranging from “very fast” to “gradual”. Under the fastest, full lifting would occur at the end of April, while under the slowest, Britain would not see restrictions eased until Aug 2.

In the end, the Government chose a path somewhere between “fast” and “medium”, yet the Imperial model predicted that would still lead to Covid hospital bed occupancy of about 15,000 to 25,000 in the summer and early autumn – which was higher than the first peak in April 2020.

Author(s): Sarah Knapton

Publication Date: 5 May 2021

Publication Site: The Telegraph (UK)

How the Gates Foundation seeded America’s COVID-19 policy catastrophes

Link: https://dossier.substack.com/p/how-the-gates-foundation-seeded-americas

Excerpt:

“There’s only one model that we look at that has the number of projected deaths which is the IHME model which is funded by the Gates Foundation,” Cuomo said on April 2, adding, “and we thank the Gates Foundation for the national service that they’ve done.”

In an April 9 briefing, Michigan Governor Gretchen Whitmer referred to the IHME model in order to project deaths and the PPE resources needed for the supposed surge.

It was the same story with the government of Pennsylvania. The PA Health Department exclusively uses IHME models to forecast coronavirus outcomes.

Governor Phil Murphy, another nursing home death warrant participant, used IHME models to navigate the state’s policy response.

Author(s): Jordan Schachtel

Publication Date: 16 February 2021

Publication Site: The Dossier at Substack

The Hard Lessons of Modeling the Coronavirus Pandemic

Link: https://www.quantamagazine.org/the-hard-lessons-of-modeling-the-coronavirus-pandemic-20210128/?mc_cid=e9f8b32129&mc_eid=983bcf5922

Excerpt:

For a few months last year, Nigel Goldenfeld and Sergei Maslov, a pair of physicists at the University of Illinois, Urbana-Champaign, were unlikely celebrities in their state’s COVID-19 pandemic response — that is, until everything went wrong.

….

Following the model’s guidance, the University of Illinois formulated a plan. It would test all its students for the coronavirus twice a week, require the use of masks, and implement other logistical considerations and controls, including an effective contact-tracing system and an exposure-notification phone app. The math suggested that this combination of policies would be sufficient to allow in-person instruction to resume without touching off exponential spread of the virus.

But on September 3, just one week into its fall semester, the university faced a bleak reality. Nearly 800 of its students had tested positive for the coronavirus — more than the model had projected by Thanksgiving. Administrators had to issue an immediate campus-wide suspension of nonessential activities.

Author: Jordana Cepelewicz

Publication Date: 28 January 2021

Publication Site: Quanta Magazine