Bond Yields Have Been On a Tear Since August 4. What’s Going On?

Link: https://mishtalk.com/economics/bond-yields-have-been-on-a-tear-since-august-4-whats-going-on

Graphic:
Excerpt:

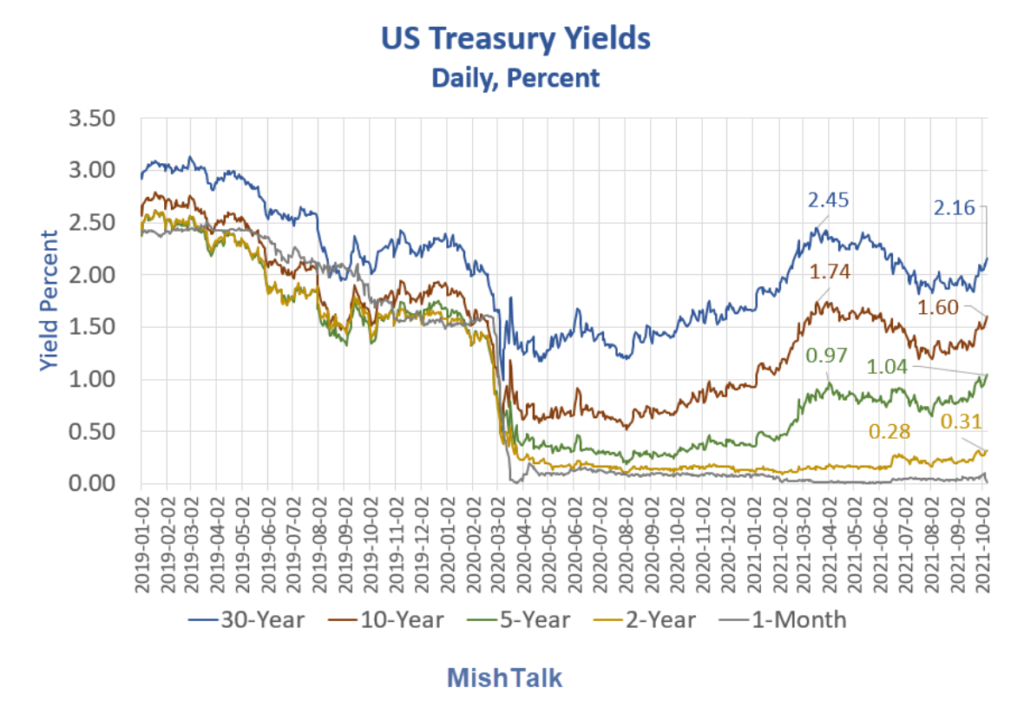
Five Factors Spooking the Bond Market and Impact

Debt Ceiling Battle: Short Term, Low Impact

Supply Chain Disruptions: Medium Term, Medium Impact

Trade Deficit: Long Term, Low-to-Medium Impact

Biden’s Build Back Better Spending Plans: Long Term, High Impact

Wage Spiral: Long Term, High Impact

Author(s): Mike Shedlock

Publication Date: 8 Oct 2021

Publication Site: Mish Talk

Huge Credit Stress Starting in China May Easily Rock the Whole World

Link: https://mishtalk.com/economics/huge-credit-stress-starting-in-china-may-easily-rock-the-whole-world

Graphic:

Excerpt:

If funding stress signs don’t emerge, don’t conclude that there is no contagion. Contagion is playing out already if you know where to look.”

The mess in China does not stop with Evergrande. 

…..

Everglade shows the theft of wealth and money in a giant Ponzi scheme, not to be confused with real savings (i.e. net tangible assets at true market value)!

There is no savings glut. 

The alleged savings glut is nothing but a fiat Ponzi scheme where central banks have to keep money supply soaring to keep asset prices (based on debt) from imploding!

How much longer this setup can continue before it blows up in a currency crisis, war with China, or some other major economic disruption remains a key mystery.

Author(s): Mike Shedlock

Publication Date: 20 Sept 2021

Publication Site: MishTalk

Investigating the Mass Hysteria Over 1 Degree in Climate Change Since 1850

Link: https://mishtalk.com/economics/investigating-the-mass-hysteria-over-1-degree-in-climate-change-since-1850

Graphic:

Excerpt:

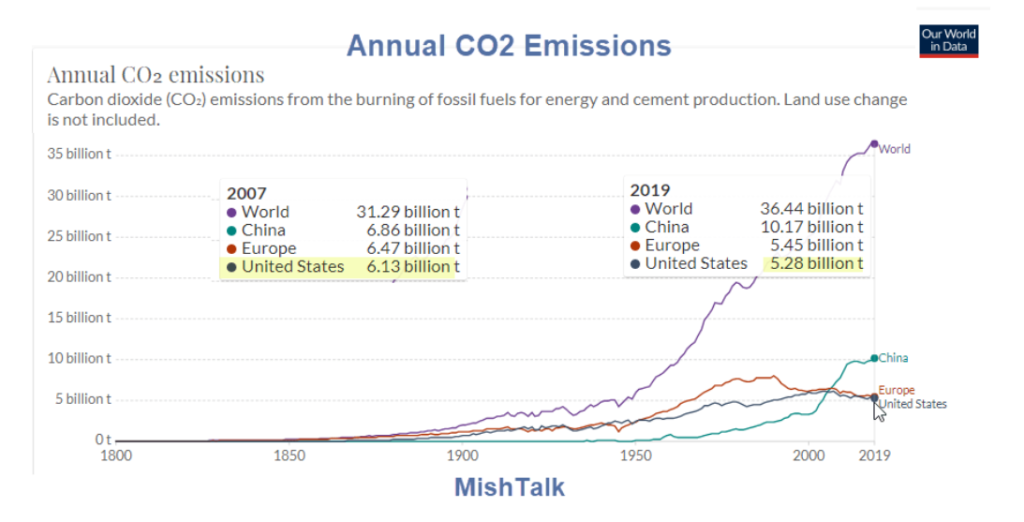
Temperatures have risen a a best estimate of 1.07°C since 1850 due to man-made causes.

The sea rise between 1971 and 2006 was 1.3 mm per year. That’s 0.0511811 inches per year. 

The sea rise between 2006 and 2018 was 3.7 mm per year. That’s 0.145669 inches per year.

Under all emissions scenarios, global warming of 1.5°C and 2°C will be exceeded during the 21st century.

Author(s): Mike Shedlock

Publication Date: 5 September 2021

Publication Site: Mish Talk

Let’s Review 50 Years of Dire Climate Forecasts and What Actually Happened

Link: https://mishtalk.com/economics/lets-review-50-years-of-dire-climate-forecasts-and-what-actually-happened

Graphic:

Excerpt:

1970 Boston Globe: Scientist Predicts New Ice Age by 21st Century said James P. Lodge, a scientist at the National Center for Atmospheric Research.
1971 Washington Post: Disastrous New Ice Age Coming says S.I. Rasool at NASA.
1972 Brown University Letter to President Nixon: Warning on Global Cooling
1974 The Guardian: Space Satellites Show Ice Age Coming Fast

…..

1989 Salon: New York City’s West Side Highway underwater by 2019 said Jim Hansen the scientist who lectured Congress in 1988 about the greenhouse effect.
2000 The Independent: “Snowfalls are a thing of the past. Our children will not know what snow is,” says senior climate researcher.
2004 The Guardian: The Pentagon Tells Bush Climate Change Will Destroy Us. “Britain will be Siberian in less than 20 years,” the Pentagon told Bush.

…..

2013 The Guardian: US Navy Predicts Ice Free Arctic by 2016. “The US Navy’s department of Oceanography uses complex modeling to makes its forecast more accurate than others.
2014 John Kerry: “We have 500 days to Avoid Climate Chaos” discussed Sec of State John Kerry and French Foreign Minister Laurent Fabious at a joint meeting.

Author(s): Mike Shedlock

Publication Date: 18 February 2021

Publication Site: Mish Talk

How Many People Are Now Covered by Unemployment Insurance?

Link: https://mishtalk.com/economics/how-many-people-are-now-covered-by-unemployment-insurance

Graphic:

Excerpt:

In April of 2020, there were 145.67 million people covered by unemployment insurance but only 133.33 million people working. 

This unusual inversion had never happened before. It lasted 4 months, April through June of 2020.

Covered Employment data is weekly, ending Saturday and lags by a week. I use a “monthly average” which run through July vs the employment level series which runs through August.

Author(s): Mike Shedlock

Publication Date: 6 September 2021

Publication Site: Mish Talk