GameStop Frenzy Lessons: Don’t Bet the Milk Money

Link: https://marypatcampbell.substack.com/p/gamestop-frenzy-lessons-dont-bet

Graph:
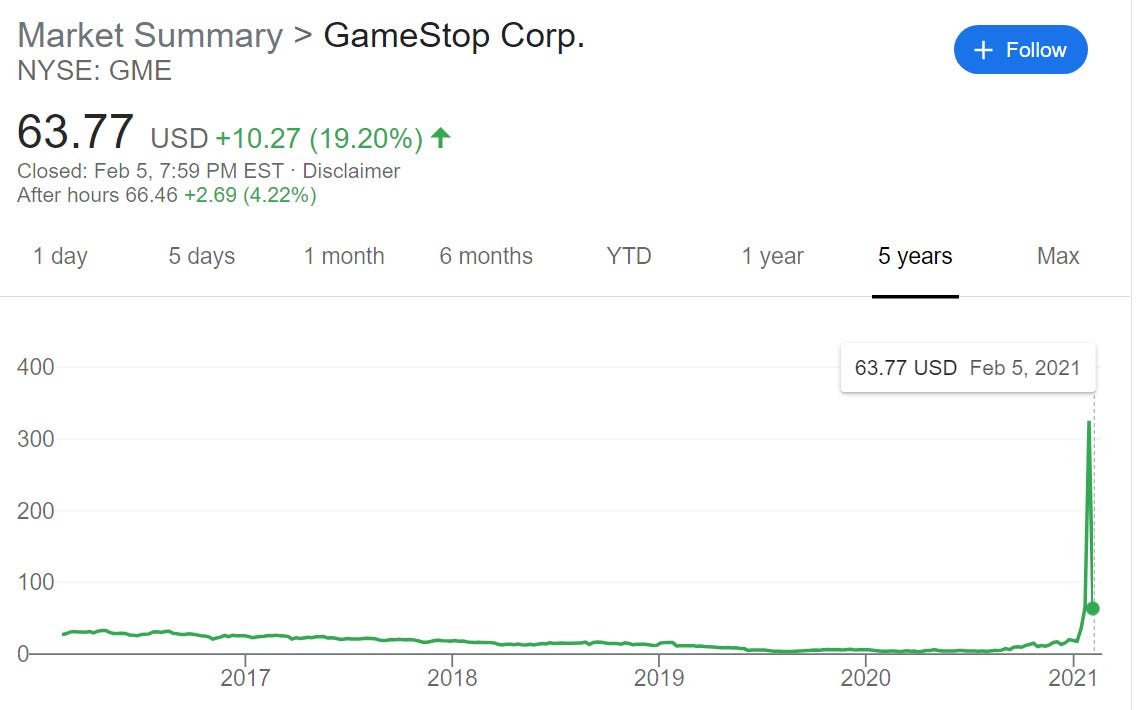
Excerpt:

The failures we hear about are when staid institutions that have existed for centuries have done something incredibly risky, leading to serious consequences.

When it comes to institutional money management…. this kind of speculation is not really in keeping with professional standards, depending on the institution.

We may find that some institutions were betting the milk money by putting too much of their cash in very risky investment strategies. But really, only if they have to absorb the losses. Perhaps various players will save Melvin Capital et. al. You never know.

Author(s): Mary Pat Campbell

Publication Date: 6 February 2021

Publication Site: STUMP

Mortality with Meep: Pennsylvania, Illinois, Ohio, Georgia, North Carolina, and Michigan by Race/Ethnicity and Week

Link: https://marypatcampbell.substack.com/p/mortality-with-meep-pennsylvania

Excerpt:

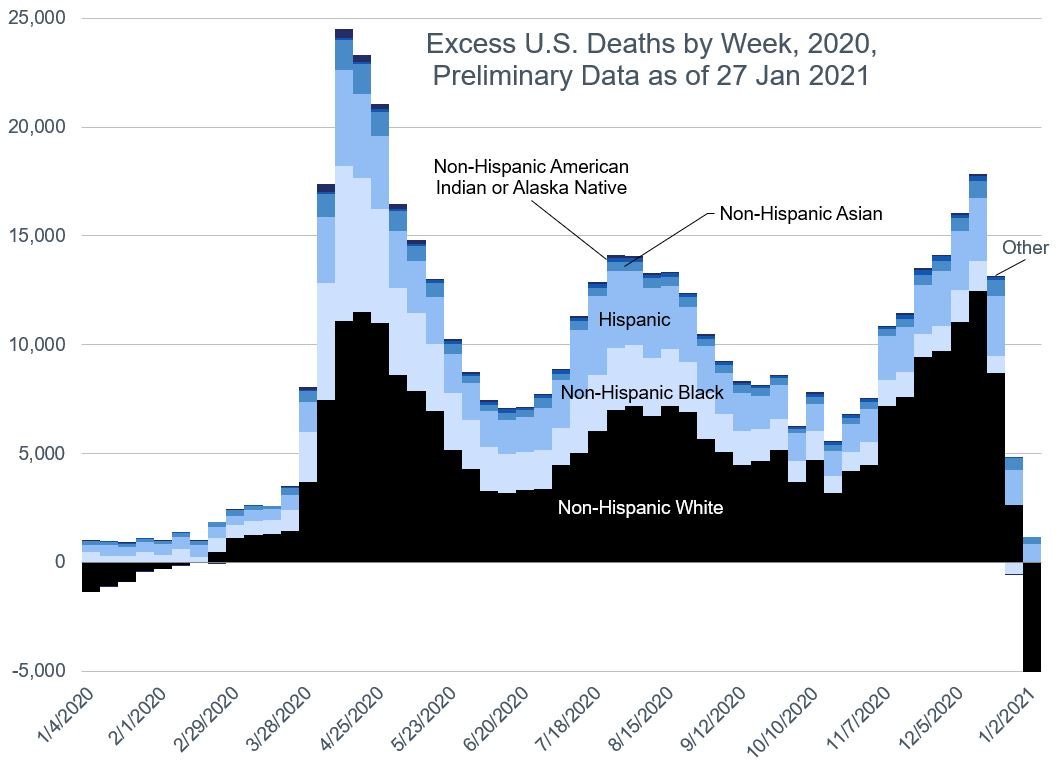
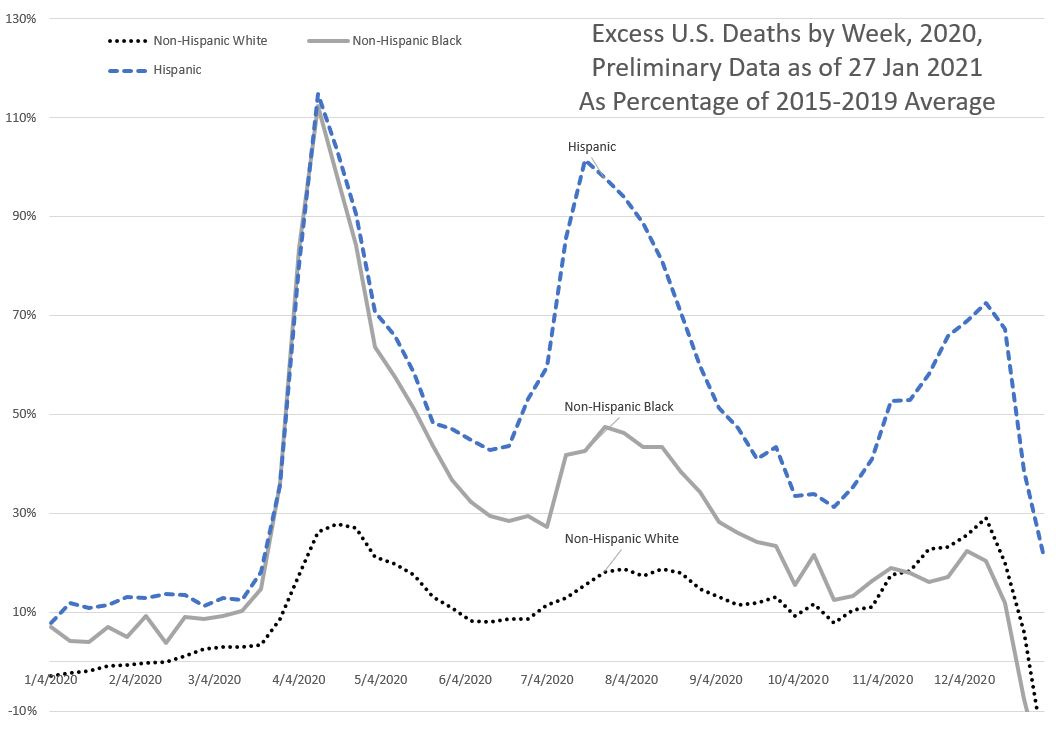
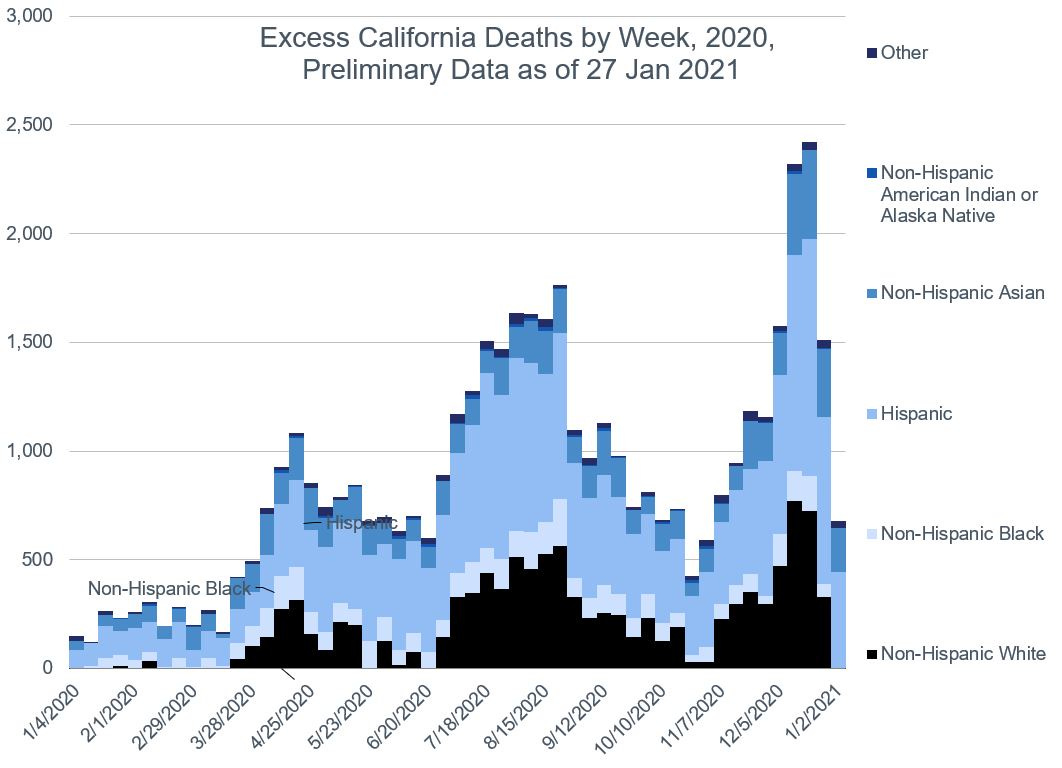
Overall, excess mortality (in a relative sense) for Hispanics is about three times than that seen by non-Hispanic Whites, and non-Hispanic Blacks have excess mortality about twice that of non-Hispanic Whites.

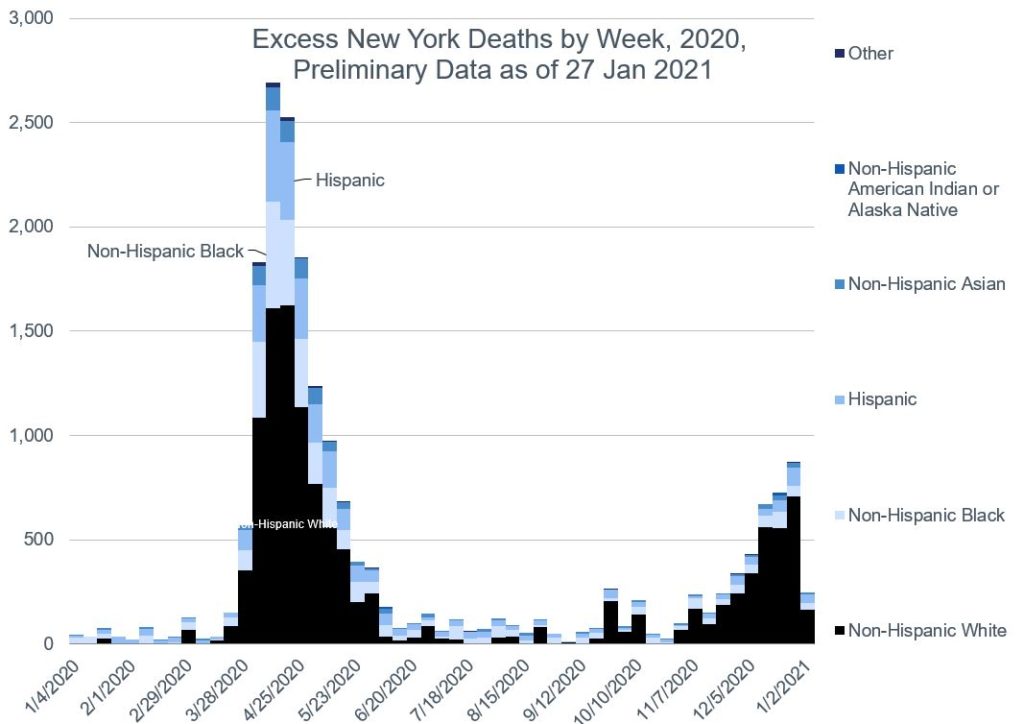
Note that New York City by itself has a very large amount of excess mortality. You can see why New York, as an area, reacted very drastically last year. When I saw the mortality spike coming from the city last year, I was just fine staying at home… because I could. The trade-offs have been relatively easy for me to see.

But it hasn’t been quite so extreme elsewhere.

Graph:

Author: Mary Pat Campbell

Publication Date: 1 February 2021

Publication Site: STUMP
Mortality with Meep: Excess Mortality in California, Texas, and Florida by Race/Ethnicity

Link: https://marypatcampbell.substack.com/p/mortality-with-meep-excess-mortality-8e2

Excerpt:

For Hispanics, it’s two thirds, with most of it coming from California (23%), then Texas (21%), then Florida (10%). New York City accounts for 9%, and then the rest of New York state for 3%.

UPDATE: Checking out the Hispanic population by state, these percentages are a little in line with national distribution — California (26% of U.S. Hispanic population), Texas (19%), Florida (9%), New York (including NYC — 6%). The most disproportionate effect comes from New York City.

Graph:

Author: Mary Pat Campbell

Publication Date: 31 January 2021

Publication Site: STUMP

Mortality with Meep: Excess Mortality in New York and New York City

Link: https://marypatcampbell.substack.com/p/mortality-with-meep-excess-mortality

Excerpt:

For the data I have as of 27 January 2021, NYC mortality provides 9% of excess mortality for non-Hispanic Black people in the entire U.S. [8,638 excess deaths for Black people in NYC out of total 99,514 excess deaths for Black people in the entire country].

We get the same statistics for Hispanics in NYC: 97,725 excess deaths for the whole country, and 8,608 in NYC alone.

So excess deaths for these two groups have about 9% each coming just from NYC alone.

Graphic:

Author: Mary Pat Campbell

Publication Date: 30 January 2021

Publication Site: STUMP