Keep Up With the Standards: On ASOP 56, Modeling

Link: https://www.soa.org/sections/modeling/modeling-newsletter/2021/april/mp-2021-04-campbell/

Excerpt:


If nothing else, having a checklist to go through while working on modeling can help you make sure you don’t miss anything. Hey, ASB, make some handy-dandy sticky note checklists we can stick on our monitors to ask us:

3.1 Does our model meet the intended purpose?

3.2 Do we understand the model, especially any weaknesses and limitations?

3.3 Are we relying on data or other information supplied by others?

3.4 Are we relying on models developed by others?

3.5 Are we relying on experts in the development of the model?

3.6 Have we evaluated and mitigated model risk?

3.7 Have we appropriately documented the model?

Author(s): Mary Pat Campbell

Publication Date: April 2021

Publication Site: The Modeling Platform at the Society of Actuaries
Public Finance: Full Accrual Accounting and Governmental Accounting Standards Board Testimony

Link: https://marypatcampbell.substack.com/p/public-finance-full-accrual-accounting

Video:

Excerpt:

I will give a very simple example: suppose Netflix makes a deal where instead of you paying for a year’s subscription at a time, you can get a big discount if you pay for 2 years’ subscription.

Subscribers love the deal and pay for it….

….and then Netflix says their sales doubled in their financial reports. That’s IF they followed cash-based accounting, which records cash flows.

But they don’t, because accounting standards boards (outside the government sphere) know that this is just a trick to boost how financials look under cash accounting. And there are loads of these tricks. I just gave one simple example. The trick of getting people to pre-pay for sales to boost the numbers is a well-known ploy on the revenue side. A well-known ploy on the expenses side is to put off paying bills.

This is obviously distorting recognizing the true economic arrangement underlying these transactions, and some of the tricks make for a more fragile economic position for specific businesses. It was always the marginal businesses, which were barely hanging on, where cash-basis accounting tempts into trickery, which usually ends in financial failure. So accounting standards have developed to prevent this stuff.

Author(s): Mary Pat Campbell

Publication Date: 22 April 2021

Publication Site: STUMP at Substack

Mortality with Meep: Location of Death Data for 1999-2020, Entire United States

Link: https://marypatcampbell.substack.com/p/mortality-with-meep-looking-at-location

Graphic:

Excerpt:

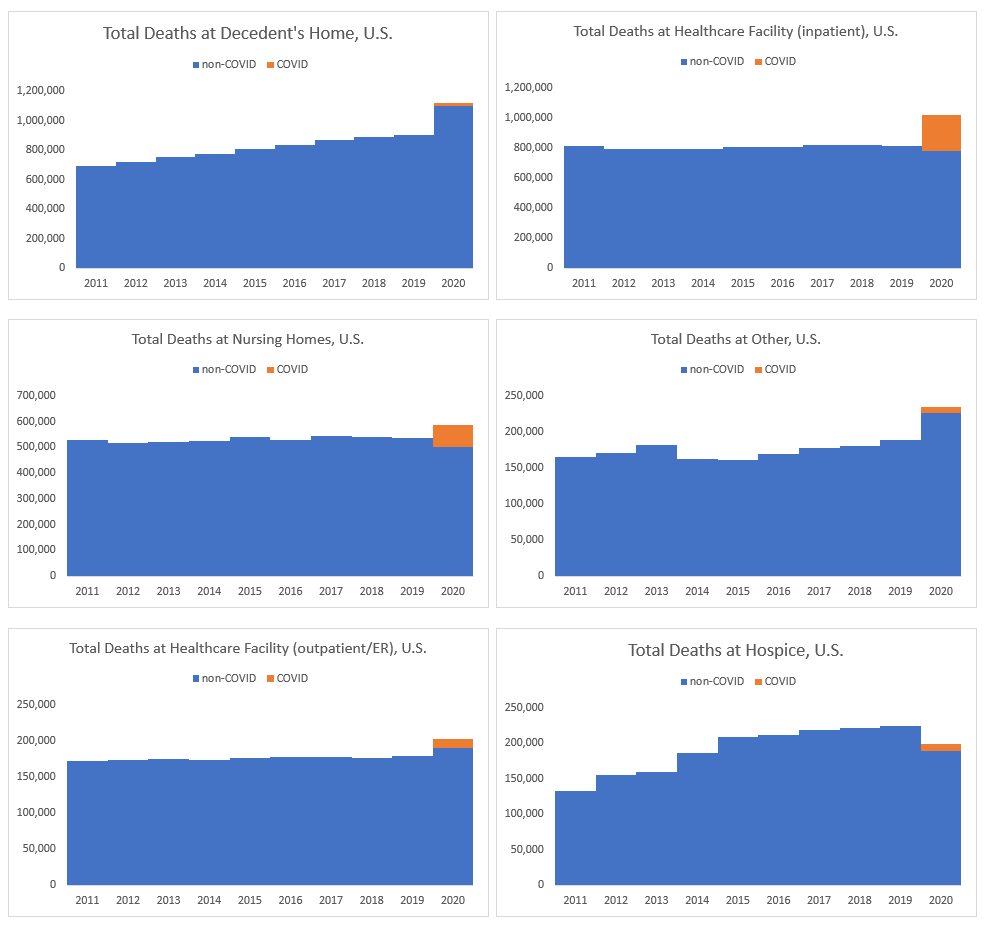
For a few locations, it’s pretty clear that COVID explains almost all their excess deaths: inpatient healthcare facilities and nursing homes. Indeed, it looks like over 100% of the nursing home excess mortality came from COVID, which accords with what I see with excess mortality for older people.

However, there is a lot of excess mortality for people who died at home, and most of that is currently unexplained by COVID.

I don’t think it will be — I think we will find those excess diabetes, heart attack, and ‘unintentional injury’ deaths will have been at home, and because of lockdowns there weren’t other people around to get these people to treatment before they died. This accords with what Emma Woodhouse saw for Illinois – that pattern holds for the entire U.S., it seems.

Author(s): Mary Pat Campbell

Publication Date: 20 April 2021

Publication Site: STUMP at substack

SALT Cap Tussle: NY Democrats Have an Ultimatum

Link: https://marypatcampbell.substack.com/p/salt-cap-tussle-ny-democrats-have

Graphic:

Excerpt:

It’s not just a matter of the state/local tax levels for each state, but also what income levels are like for the state.

In any case, the pattern of which states’ taxpayers get the biggest boost from SALT deductibility might surprise you a little, such as with Utah and Georgia. But many aren’t surprising at all, such as New York and New Jersey.

But even without considering the geographical footprint, obviously high-income folks get the biggest boost from removing the SALT cap. This has been known since the TCJA back in 2017 when they imposed the cap to begin with. It’s partly why it was done.

Author(s): Mary Pat Campbell

Publication Date: 15 April 2021

Publication Site: STUMP at substack

Mortality with Meep: Top Causes of Death in the United States in 2020

Link: https://marypatcampbell.substack.com/p/mortality-with-meep-top-causes-of

Graphic:

Excerpt:

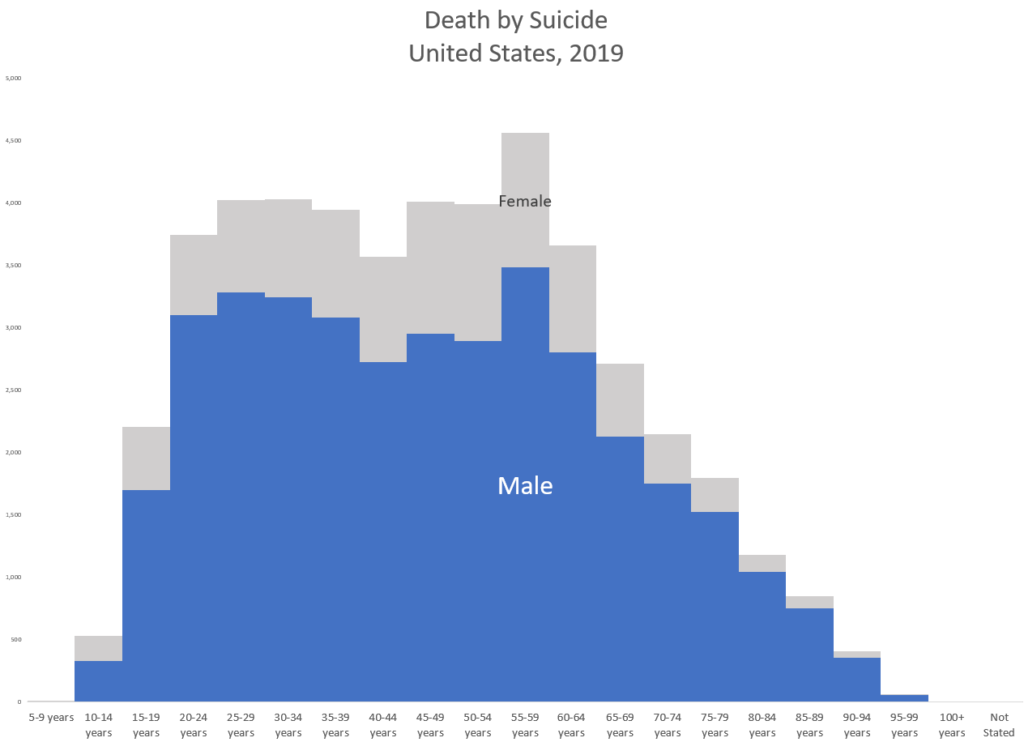
You’ll see that among adults, the age range with the most suicides are people age 50-55. That’s due to two things: the number of people in that age range (early Gen X, so tailing off from Boomers) and the rate. For each age group far more males die by suicide than do females.

You can see that deaths by suicide in number drop off in old age…. but that’s because the population is dropping off in size (as mortality rates accelerate at high ages).

Author(s): Mary Pat Campbell

Publication Date: 12 April 2021

Publication Site: STUMP at substack

Mortality with Meep: Ranking the States (and NYC and DC) by Excess Mortality

Link: https://marypatcampbell.substack.com/p/mortality-with-meep-ranking-the-states

Graphic:

Excerpt:

The three worst areas just pop out: Arizona, New Jersey, and New York City.

(Also popping out: the hole where North Carolina should be. I’m going to guess it has landed in the midrange of states, like its neighbors South Carolina and Tennessee.)

New York state excluding NYC (which is what the NY square represents) is middle-of-the-pack for excess mortality, which is hardly surprising – as most of New Jersey is crowded near NYC, New York state is geographically huge and has significant populations on the Great Lakes, far away from NYC.

The lowest excess mortality also really pops out: some states bordering on the edges of Canada, plus Hawaii. It is a little surprising that Washington State, in particular, has not been hit hard by COVID mortality.

Author(s): Mary Pat Campbell

Publication Date: 1 April 2021

Publication Site: STUMP at substack

MoneyPalooza Monstrosity: State and Local Governments Should Pay Down Pension Debt

Link: https://marypatcampbell.substack.com/p/moneypalooza-monstrosity-state-and

Graphic:

Excerpt:

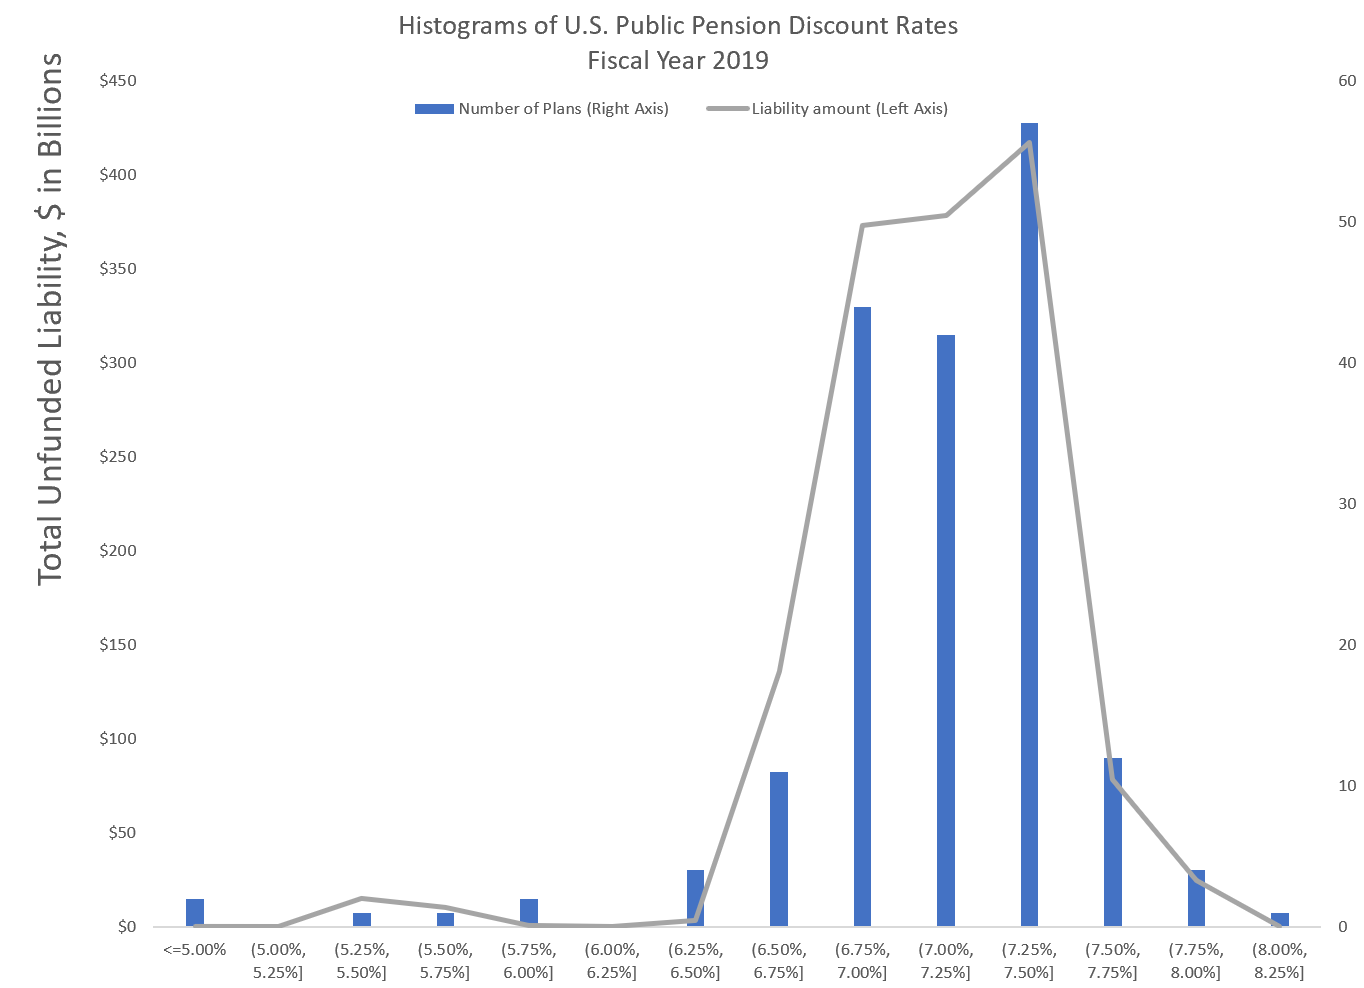
If a state or local government’s public pension funds have large unfunded liabilities, those liabilities accrue at the assumed rate of return on the assets that should have been there to cover that liability.

…..

The point is this: if it makes sense to pay down the pension unfunded liability with muni bonds, thus creating new liabilities and thus new leverage, it makes even more sense to take a “windfall” of cash and pay down the pension debt, which creates no new state/local government liabilities

Author(s): Mary Pat Campbell

Publication Date: 26 March 2021

Publication Site: STUMP on Substack

Geeking Out: House of Representatives Apportionment Visualization 1910-2010

Link: https://marypatcampbell.substack.com/p/geeking-out-house-of-representatives

Graphic:

Excerpt:

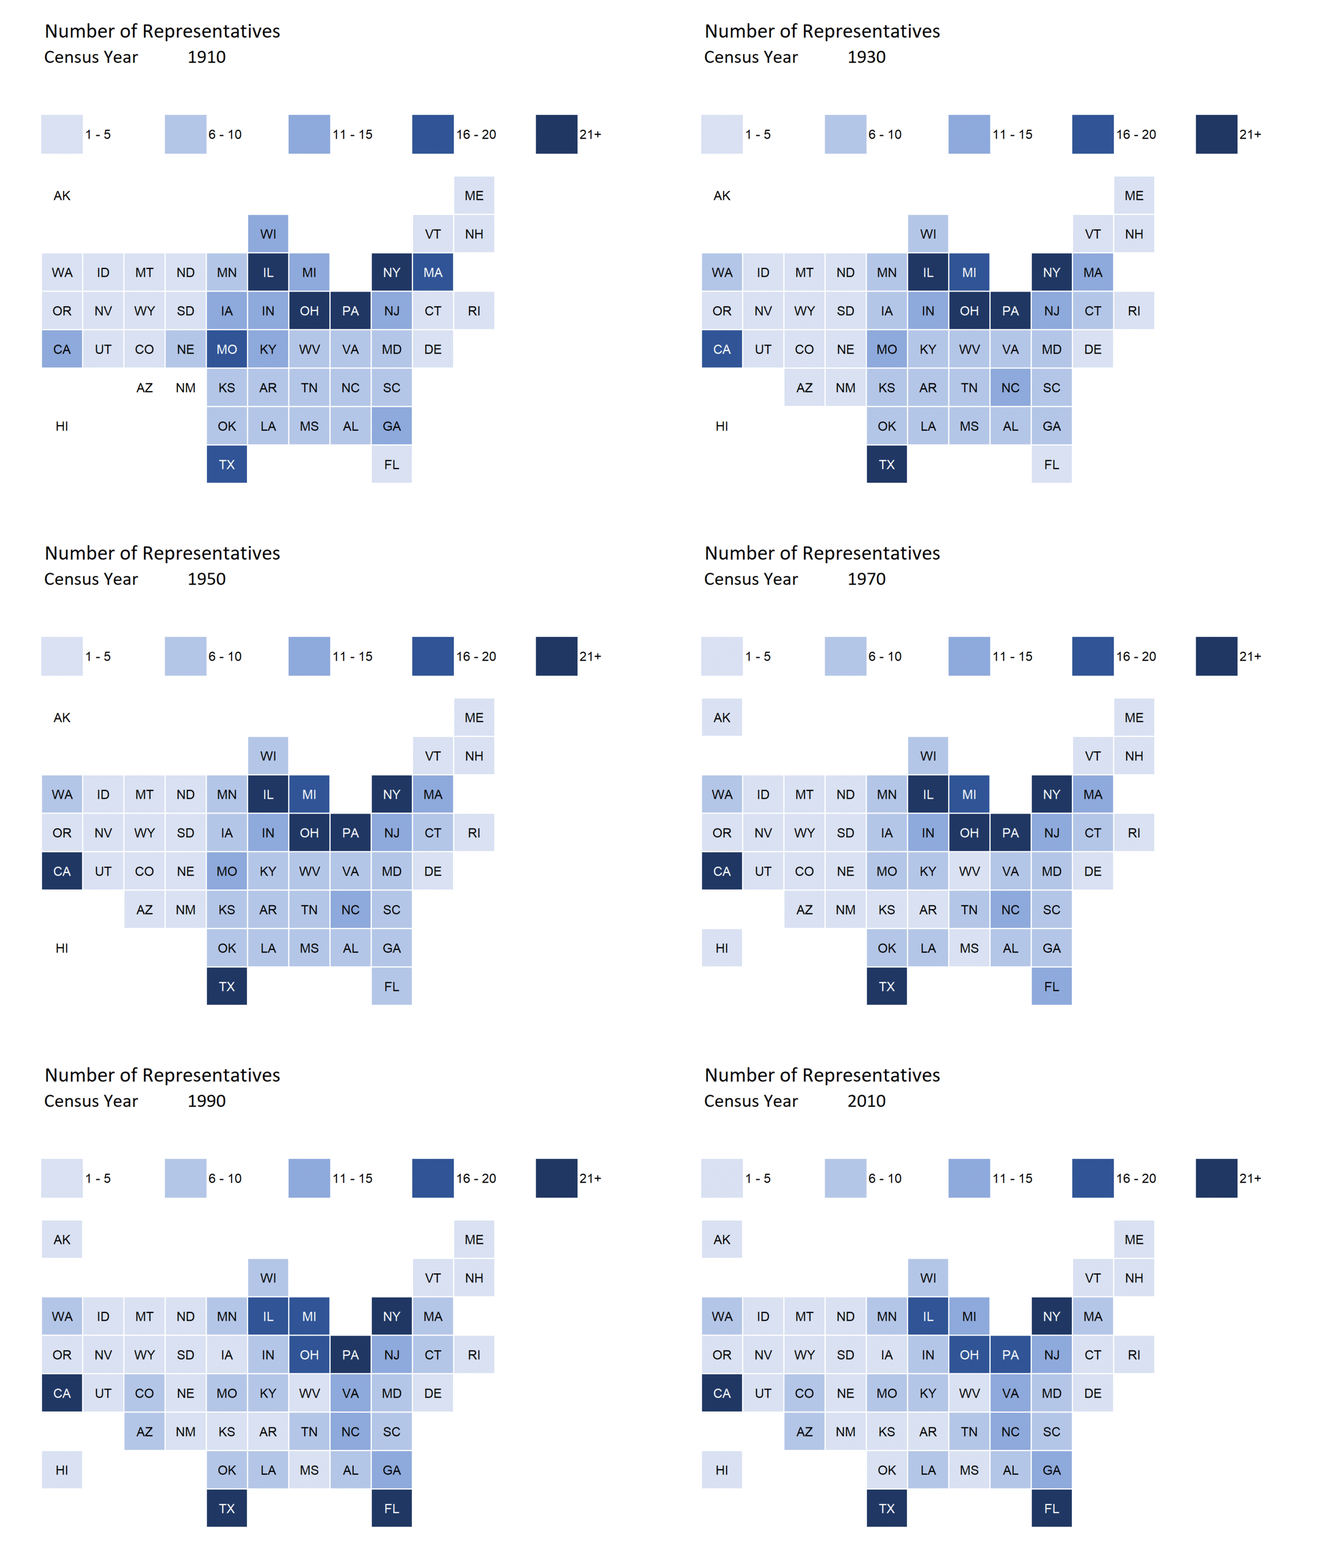
So you can see how the dominating states change in the House of Representatives:

in 1910, it was Illinois, Ohio, Pennsylvania, and New York

in 2010, it was New York, California, Texas, and Florida

While New York was a large state throughout this visualization, Ohio, Pennsylvania, and Illinois dropped out and California, Texas, and Florida rose up.

Author(s): Mary Pat Campbell

Publication Date: 24 March 2021

Publication Site: STUMP at Substack

Quick-Takes: Mortality Update, Meep’s Math Matters, and a Few Bailout Reactions

Link: https://marypatcampbell.substack.com/p/quick-takes-mortality-update-meeps

Excerpt:

A few remarks — the total public pension unfunded liability (using the discount rates they themselves use, that is, too high, and thus valuing the unfunded liability too little) is the same size as the full American Rescue Plan Act of 2021 — that is, $1.9 trillion.

That is not how much is getting shoveled to the various state and local governments.

Graphic:

Video:

Author(s): Mary Pat Campbell

Publication Date: 21 March 2021

Publication Site: STUMP at Substack

CDC death data as of 17 March 2021 U.S. Dashboards

Video:

Description:

I review national-level U.S. mortality data from 2020 into 2021 (last updated 3/17/2021, weekly data through the week ending 3/6/2021), using the CDC’s own dashboards.

Breakdown by total numbers, states, age group, racial/ethnic group, non-COVID major causes.

CDC excess mortality dashboards: https://www.cdc.gov/nchs/nvss/vsrr/covid19/excess_deaths.htm

Author(s): Mary Pat Campbell

Publication Date: 18 March 2021

Publication Site: Meep’s Math Matters at YouTube