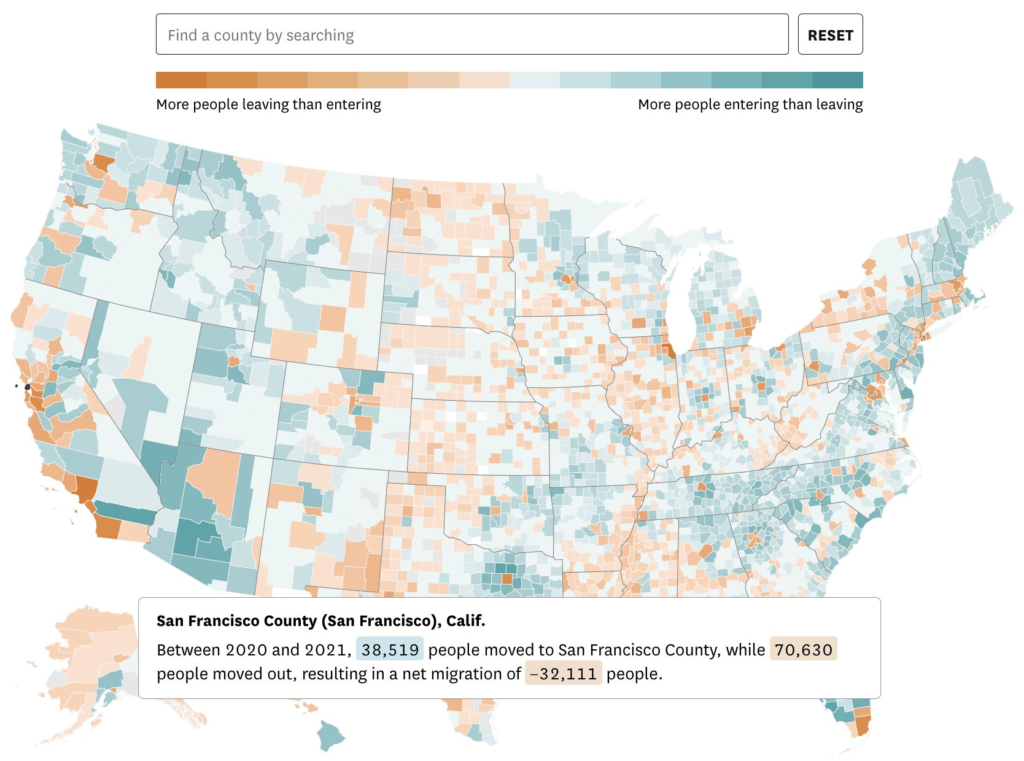
Link: https://www.sfchronicle.com/projects/2023/maps-migration/
Tweet:
Graphic:

Author(s): Nami Sumida
Publication Date: 2 Jun 2023 (also 31 May 2023) accessed 7 Jun 2023
Publication Site: San Francisco Chronicle
All about risk
Link: https://www.sfchronicle.com/projects/2023/maps-migration/
Tweet:
Graphic:

Author(s): Nami Sumida
Publication Date: 2 Jun 2023 (also 31 May 2023) accessed 7 Jun 2023
Publication Site: San Francisco Chronicle
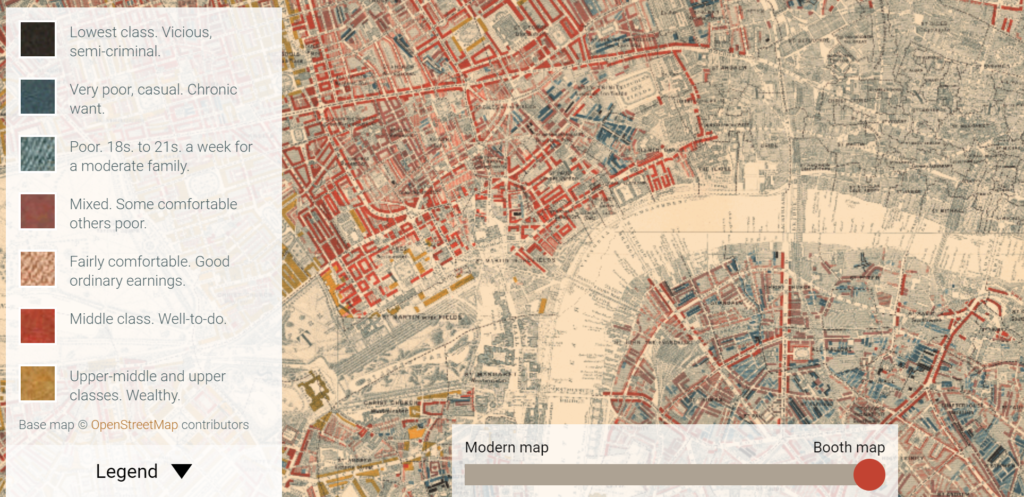
Link: https://booth.lse.ac.uk/map/12/-0.0421/51.5132/100/0
Graphic:

Additional: https://booth.lse.ac.uk/learn-more/what-were-the-poverty-maps
Excerpt:
The Maps Descriptive of London Poverty are perhaps the most distinctive product of Charles Booth’s Inquiry into Life and Labour in London (1886-1903). An early example of social cartography, each street is coloured to indicate the income and social class of its inhabitants.
….
The first edition of the poverty maps was based on information gathered from School Board visitors. A first sheet covering the East End was published in the first volume of Labour and Life of the People, Volume 1: East London (London: Macmillan, 1889) as the Descriptive Map of East End Poverty. The map was expanded in 1891 to four sheets – covering an area from Kensington in the west to Poplar in the east, and from Kentish Town in the north to Stockwell in the south – and published in subsequent volumes of the survey. These maps are collectively known as the Descriptive Map of London Poverty 1889. They use Stanford’s Library Map of London and Suburbs at a scale of 6 inches to 1 mile (1:10560) as their base. A digital image of the 1889 map has been made by the University of Michigan.
The original working maps from this first edition of the poverty maps are held at the Museum of London. These are hand-coloured and use the 1869 Ordnance Survey 1:2500 maps as their base.
Download the maps: https://booth.lse.ac.uk/learn-more/download-maps
Link: https://koenvandeneeckhout.medium.com/behind-the-maps-66d6377b8644
Graphic:

Excerpt:
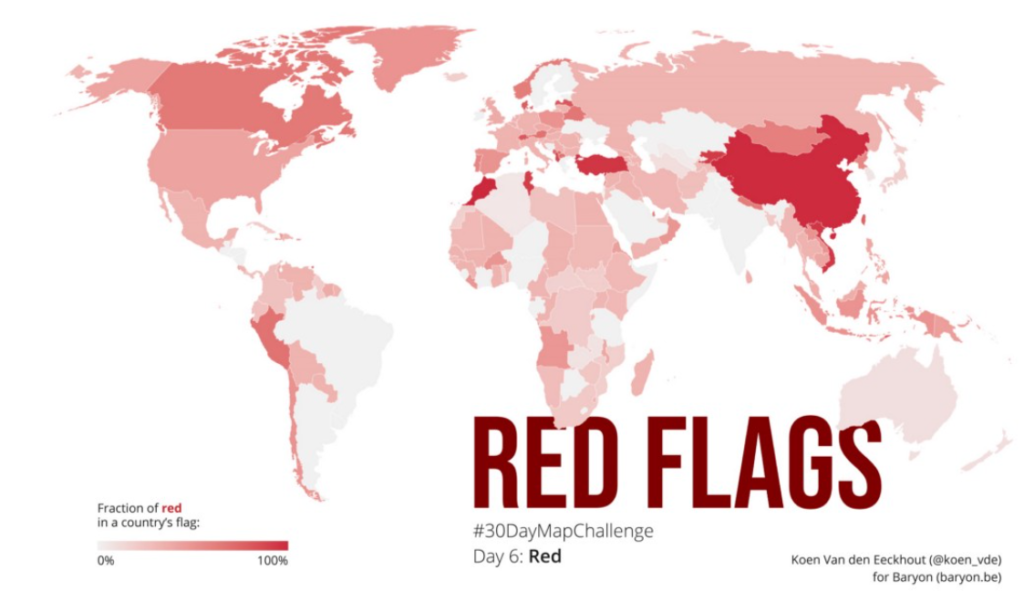
Data: I don’t know how the idea popped into my head, but I always wanted to do something with 🚩 country flags, and the color schemes they use. I had found a suitable set of all the countries’ flags in .svg format, but was struggling to extract specific colors from them. Googling around I stumbled upon the Image Color Summarizer, which partly did what I was looking for, but not entirely. I was saved when I found out that Martin Krzywinski, creator of the tool, had many other tools and examples on his mindblowing website — including an overview of all the colors in all of the different flags! 🤯 The most difficult part left to do was defining when a color was ‘red’ — #FF0000 is obviously red, but what about #D62612 (in the Bulgarian flag)? Or #FBDE4A (in the flag of Congo-Brazzaville)? This was done more or less manually by going through the entire list and quickly verifying any colours for which I had doubts.
Author(s): Koen Van den Eeckhout
Publication Date: 6 January 2021
Publication Site: Koen Van den Eeckhout