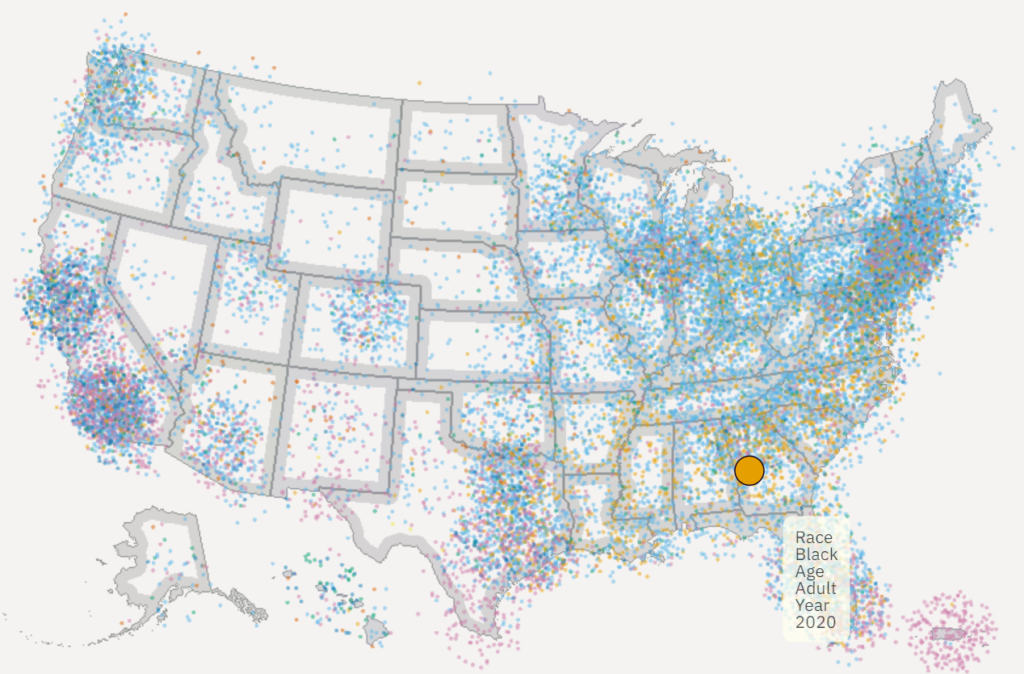
All of US: a dot density map of the United States

Link: https://all-of-us.benschmidt.org/

Graphic:
Excerpt:

One point per person in the US for the 2010 and 2020 censuses, fully zoomable and interactive using WebGL and [Deepscatter](https://github.com/CreatingData/deepscatter). Since this uses WebGL individual point rendering and quadtiled data, it can be far more responsive than raster-based maps you may have seen in 2010. Plus, if you zoom all the way in in some views it has little person glyphs!

Author(s): Ben Schmidt

Publication Date: accessed 2 Dec 2022

Publication Site: Ben Schmidt’s personal site

$350 Billion Covid “Bailout” To States, Cities, And Counties – Here’s What You Need To Know

Link: https://www.forbes.com/sites/adamandrzejewski/2021/03/03/350-billion-covid-bailout-to-states-cities-and-counties–here-are-the-details/?sh=626de35e661c

Graphic:

Excerpt:

This week, the U.S. House passed, along party lines, the $1.9 trillion American Rescue Plan Act of 2021. A vote in the U.S. Senate is expected soon.

Buried within the 591-page bill is a $350 billion bailout for 50 states, tribal governments, U.S. territories, and more than 30,000 cities and counties.

Our auditors at OpenTheBooks.com finally located the $350 billion allocation, line-by-line, in a supplemental database hidden on the back end of the House Oversight Committee’s website.

Map Link: https://www.openthebooks.com/maps/?Map=90043&MapType=Pin

CBO data: https://www.openthebooks.com/assets/1/6/CD13263501.pdf

Author(s): Adam Andrzejewski

Publication Date: 3 March 2021

Publication Site: Forbes