Interpreting Pandemic-Related Decreases in Life Expectancy

Link:https://www.actuary.org/node/14837

Graphic:

Excerpt:

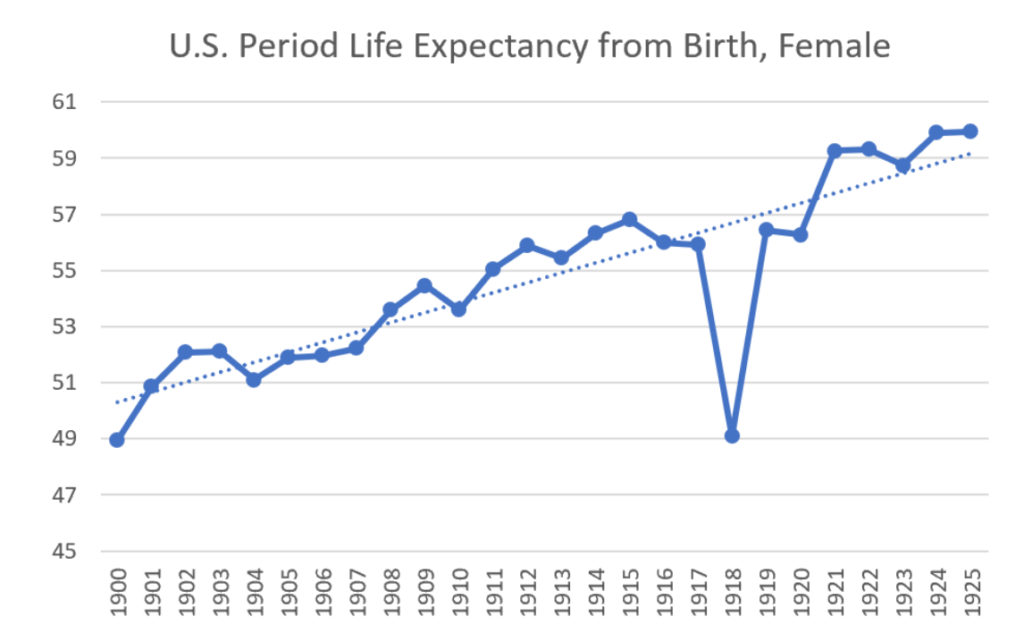
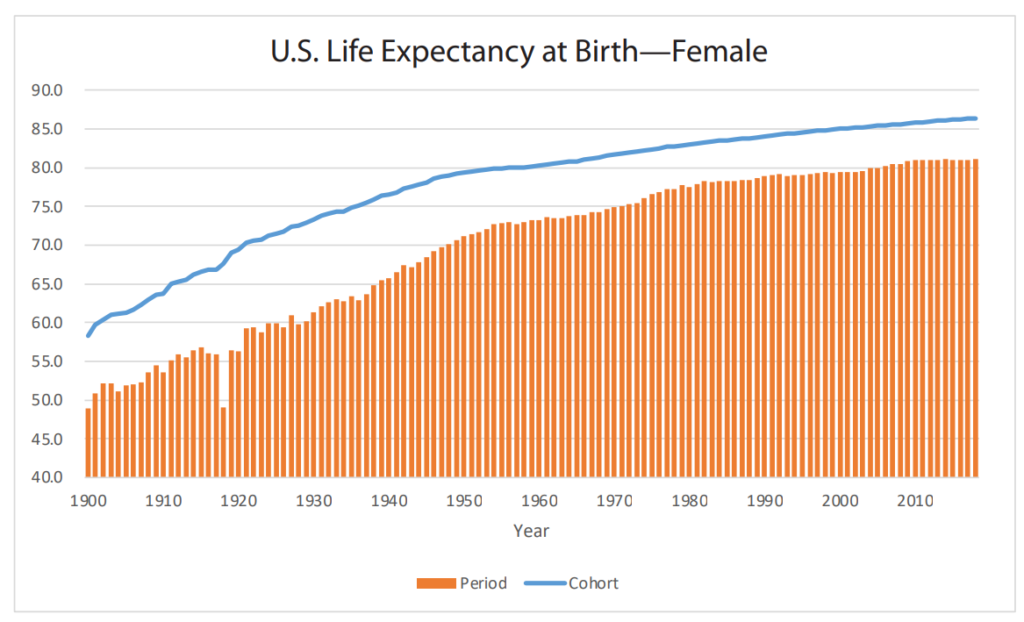
Period life expectancy measures demonstrate fluctuations that reflect events that influenced mortality in this particular period.14 For example, the Spanish flu pandemic of 1918 resulted in a dramatic decrease in period life expectancy, which was more than offset by an increase in period life expectancy the next year. A male baby born in 1917 had a period life expectancy of 52.2 years, while a male baby born in 1918 had a period life expectancy of only 45.3 years—a reduction of almost 7 years.15 The following year, a male newborn had a period life expectancy of 54.2, an increase of almost 9 years over the period life expectancy calculated in 1918 for a newborn male. These changes are much larger than those seen thus far with COVID-19, demonstrating the relative severity of that earlier pandemic relative to the current one.

It is instructive to review the impact of calculating life expectancies on a cohort basis, rather than a period basis, for these three cohorts of male newborns in the late 1910s. Using mortality rates published by the SSA for years after 1917, for a cohort of 1917 male newborns, the average life span was 59.4; for the 1918 cohort, average life span was 60.0; and for 1919, it was 61.5. Even these differences are heavily influenced by the fact that the 1917 and 1918 cohorts had to survive the high rates of death during 1918, while the 1919 cohort did not.

If both period and cohort life expectancy are measured as of 1920 for each of these groups (the 3-year-old children who were born in 1917, 2-year-old children who were born in 1918 and 1-year-old children who were born in 1919), differences are observed in these measures as they narrow substantially because the high rates of mortality during 1918 have no effect on those who survived to 1920. This is summarized in the table below.

Author(s): Pension Committee

Publication Date: December 2021

Publication Site: American Academy of Actuaries
Clarifying Misunderstanding of Life Expectancy and COVID-19

Link:https://www.actuary.org/sites/default/files/2022-02/EELifeExpectancy.pdf

Graphic:

Excerpt:

Basically, there are two life expectancy measures—
period life expectancy and cohort life expectancy.
Period life expectancy generally is based on the
assumption that current rates of death continue
indefinitely. Cohort life expectancy is more heavily
influenced by long-term expectations. Period life
expectancies can vary dramatically from one year to the
next when there is a short-term increase in mortality.

….

Period life expectancy can be a
useful metric for year-over-year
comparisons in normal times but
tends to exaggerate the effect of
nonrecurring events. Cohort life
expectancy is likely what most people
envision when thinking about the
concept of life expectancy because
cohort life expectancy is an estimate
of the actual number of years
that a typical individual might be
expected to live based on reasonable
expectations for future conditions.
For this reason, cohort life expectancy
is the measure used by the Actuaries
Longevity Illustrator that can help
individuals estimate how long they
might live.

Publication Date: Feb 2022

Publication Site: American Academy of Actuaries

Who Cares About Life Expectancy?

Link:https://contingencies.org/who-cares-about-life-expectancy/

Excerpt:

Life expectancy at birth (LEB) in the U.S. has grown about 50% since 1900, with most of the increase going to upper income groups. (See “Differences in Life Expectancy by Income Level”; Contingencies;July/August 2016.)Depending on the data source and the methodology used to determine it, LEB in the U.S. is about 77 and 82 for males and females, respectively.

I’m a retiree, so I’m more interested in life expectancy at age 65 (LE65). (OK, fine, life expectancy at a somewhat higher age is more pertinent for me, but LE65 is the more common measurement.) LE65 in America is about 18.2 and 20.8 for males and females, again depending on the dataset and methodology.

LEB and LE65 in America are calculated from a dataset of 330 million lives. Another dataset of 7.5 billion lives provides a LEB of 68 and 72 for males and females, a significant difference from the LEB mentioned earlier. The 7.5-billion-life dataset was the world population rather than the U.S. population subset. A meaningful LEB requires homogeneity of the underlying dataset.

Author(s): Bob Rietz

Publication Date: Jan/Feb 2022

Publication Site: Contingencies

Book Review: Lifespan

Link:https://astralcodexten.substack.com/p/book-review-lifespan

Graphic:

Excerpt:

David Sinclair – Harvard professor, celebrity biologist, and author of Lifespan – thinks solving aging will be easy. “Aging is going to be remarkably easy to tackle. Easier than cancer” are his exact words, which is maybe less encouraging than he thinks.

There are lots of ways that solving aging could be hard. What if humans worked like cars? To restore an old car, you need to fiddle with hundreds of little parts, individually fixing everything from engine parts to chipping paint. Fixing humans to such a standard would be way beyond current technology.

Or what if the DNA damage theory of aging was true? This says that as cells divide (or experience normal wear and tear) they don’t copy their DNA exactly correctly. As you grow older, more and more errors creep in, and your cells become worse and worse at their jobs. If this were true, there’s not much to do either: you’d have to correct the DNA in every cell in the body (using what template? even if you’d saved a copy of your DNA from childhood, how do you get it into all 30 trillion cells?) This is another nonstarter.

Sinclair’s own theory offers a simpler option. He starts with a puzzling observation: babies are very young [citation needed]. If a 70 year old man marries a 40 year old woman and has a baby, that baby will start off at zero years old, just like everyone else. Even more interesting, if you clone a 70 year old man, the clone start at zero years old.

….

So Sinclair thinks aging is epigenetic damage. As time goes on, cells lose or garble the epigenetic markers telling them what cells to be. Kidney cells go from definitely-kidney-cells to mostly kidney cells but also a little lung cell and maybe some heart cell in there too. It’s hard to run a kidney off of cells that aren’t entirely sure whether they’re supposed to be kidney cells or something else, and so your kidneys (and all your other organs) break down as you age. He doesn’t come out and say this is literally 100% of aging. But everyone else thinks aging is probably a combination of many complicated processes, and I think Sinclair thinks it’s mostly epigenetic damage and then a few other odds and ends that matter much less.

Author(s): Scott Alexander

Publication Date: 1 Dec 2021

Publication Site: Astral Codex Ten

THE DARTH VADER RULE

Link:https://www.sav.sk/journals/uploads/1030150905-M-O-W.pdf

doi: : 10.2478/v10127-012-0025

Graphic:

Excerpt:

In life insurance mathematics, the concept of a survival function is commonly
used in life expectancy calculations. The survival function of a random variable X
is defined at x as the probability that X is greater than a specific value x. For
a non-negative random variable whose expected value exists, the expected value
equals the integral of the survival function. We propose to designate this result
as the Darth Vader Rule1. It holds for any type of random variable, although its
most general form relies on the integration by parts formula for the Lebesgue-
-Stieltjes integral, fully developed by H e w i t t [3]. This result, while known (and
stated in F e l l e r [1]), is not widely disseminated except in life insurance mathematics texts; but it is worth knowing and popularizing because it provides an
efficient tool for calculation of expected value, and gives insight into a property
common to all types of random variables.
We give a proof of the Darth Vader Rule which works for all random variables which are non-negative almost surely and whose expected value exists.
The proof is based not on the Lebesgue integral formulation of [3], but on the
generalized Riemann integration of H e n s t o c k and K u r z w e i l [2], [4]. Since
every Lebesgue integrable function is also generalized Riemann integrable, the
proof here includes all cases covered by [3].
While the result is simple to state and comprehend, its proof using Lebesgue
integral theory is somewhat complex.

Author(s): Pat Muldowney — Krzysztof Ostaszewski — Wojciech Wojdowski

Publication Date: 2012

Publication Site: Tatra Mountains Mathematical Publications

Life expectancy across the UK

Link:https://www.clubvita.co.uk/news-and-insights/life-expectancy-across-the-uk

Graphic:

Excerpt:

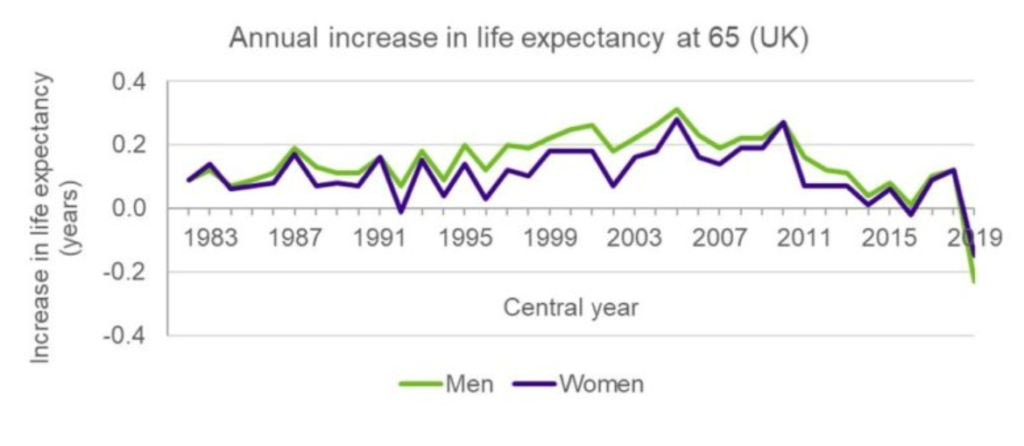
The ONS (‘Office of National Statistics) produces annual updates on period life expectancy in the UK – the so-called National Life Tables. The latest tables are based on the 2018 to 2020 period, and therefore are the first to pick up the impact of the COVID-19 pandemic. Given the significantly increased death rates seen in 2020, this fall in life expectancy is not unexpected. However, it is important to note that the headline figures hide a wide variety of underlying impacts at a more granular level.

Author(s): Conor O’Reilly

Publication Date: 27 Sept 2021

Publication Site: Club Vita

Inequality in Mortality between Black and White Americans by Age, Place, and Cause, and in Comparison to Europe, 1990-2018

Link:https://www.nber.org/papers/w29203

Graphic:

Excerpt:

Although there is a large gap between Black and White American life expectancies, the gap fell 48.9% between 1990-2018, mainly due to mortality declines among Black Americans. We examine age-specific mortality trends and racial gaps in life expectancy in rich and poor U.S. areas and with reference to six European countries.
Inequalities in life expectancy are starker in the U.S. than in Europe. In 1990 White Americans and Europeans in rich areas had similar overall life expectancy, while life expectancy for White Americans in poor areas was lower. But since then even rich White Americans have lost ground relative to Europeans. Meanwhile, the gap in life expectancy between Black Americans and Europeans decreased by 8.3%.
Black life expectancy increased more than White life expectancy in all U.S. areas, but improvements in poorer areas had the greatest impact on the racial life expectancy gap. The causes that contributed the most to Black mortality reductions included: Cancer, homicide, HIV, and causes originating in the fetal or infant period.
Life expectancy for both Black and White Americans plateaued or slightly declined after 2012, but this stalling was most evident among Black Americans even prior to the COVID-19 pandemic. If improvements had continued at the 1990-2012 rate, the racial gap in life expectancy would have closed by 2036. European life expectancy also stalled after 2014. Still, the comparison with Europe suggests that mortality rates of both Black and White Americans could fall much further across all ages and in both rich and poor areas.

Author(s): Hannes Schwandt, Janet Currie, Marlies Bär, James Banks, Paola Bertoli, Aline Bütikofer, Sarah Cattan, Beatrice Zong-Ying Chao, Claudia Costa, Libertad Gonzalez, Veronica Grembi, Kristiina Huttunen, René Karadakic, Lucy Kraftman, Sonya Krutikova, Stefano Lombardi, Peter Redler, Carlos Riumallo-Herl, Ana Rodríguez-González, Kjell Salvanes, Paula Santana, Josselin Thuilliez, Eddy van Doorslaer, Tom Van Ourti, Joachim Winter, Bram Wouterse & Amelie Wuppermann

DOI 10.3386/w29203

WORKING PAPER 29203

Publication Date: September 2021

Publication Site: NBER

Why Black Lives Got Longer

Link:https://www.wsj.com/articles/why-black-lives-got-longer-nber-longevity-racial-gap-11631905217

Excerpt:

“Between 1990 and 2018,” the paper reports, “the U.S. White-Black life expectancy gap decreased from 7.0 to 3.6 years.” A black person born in the U.S. in 1990 could be expected to live to about age 69, compared to 76 for a white person. In the intervening generation, black life expectancy rose about twice as fast as white life expectancy. A black person born in 2018 could be expected to live just over age 75, compared to just under 79 for a white person.

The drivers, the authors say, are primarily “greater reductions in Black relative to White death rates due to cancer, homicide, HIV, and causes originating in the fetal or infant period.” The most pronounced reductions in black mortality are among children and adults under age 65, rather than the elderly.

“Deaths of despair” (deaths from suicide, drug overdoses, and alcohol-related disease) increased among black and white Americans, especially in the last decade, but took a larger toll on white life expectancy. That accounted for 16.2% of the narrowing of the racial gap. The linear extension of life expectancies for both races stopped after 2012, meaning that it’s hard to see much effect from ObamaCare’s health insurance expansion in the data.

Author(s): The Editorial Board

Publication Date: WSJ

Publication Site: 11 Oct 2021

Quantifying impacts of the COVID-19 pandemic through life-expectancy losses: a population-level study of 29 countries

Link:https://academic.oup.com/ije/advance-article/doi/10.1093/ije/dyab207/6375510

Graphic:

Life expectancy at birth (age 0, left panel) and at age 60 years (right panel) by country and sex, in 2015, 2019 and 2020. Estimates for females (red), males (blue), 2015 (|), 2019 (+), 2020 (○). Countries are sorted from highest to lowest levels of female life expectancy at birth in 2019. *Estimates for Chile, Greece and Germany were available from 2016. All data points are provided in a table in Supplementary File 2, available as Supplementary data at IJE online. An interactive version of this visualization is available at https://covid19.demographicscience.ox.ac.uk/lifeexpectancy.

Abstract:

Background

Variations in the age patterns and magnitudes of excess deaths, as well as differences in population sizes and age structures, make cross-national comparisons of the cumulative mortality impacts of the COVID-19 pandemic challenging. Life expectancy is a widely used indicator that provides a clear and cross-nationally comparable picture of the population-level impacts of the pandemic on mortality.Methods

Life tables by sex were calculated for 29 countries, including most European countries, Chile and the USA, for 2015–2020. Life expectancy at birth and at age 60 years for 2020 were contextualized against recent trends between 2015 and 2019. Using decomposition techniques, we examined which specific age groups contributed to reductions in life expectancy in 2020 and to what extent reductions were attributable to official COVID-19 deaths.Results

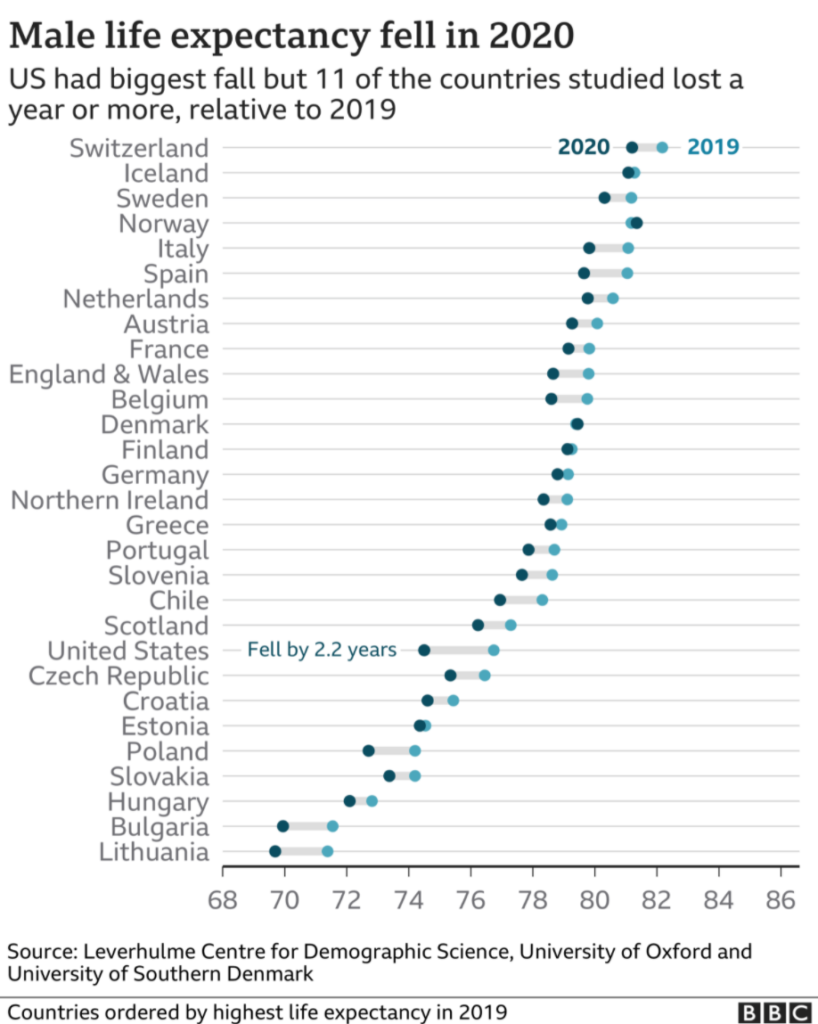
Life expectancy at birth declined from 2019 to 2020 in 27 out of 29 countries. Males in the USA and Lithuania experienced the largest losses in life expectancy at birth during 2020 (2.2 and 1.7 years, respectively), but reductions of more than an entire year were documented in 11 countries for males and 8 among females. Reductions were mostly attributable to increased mortality above age 60 years and to official COVID-19 deaths.Conclusions

The COVID-19 pandemic triggered significant mortality increases in 2020 of a magnitude not witnessed since World War II in Western Europe or the breakup of the Soviet Union in Eastern Europe. Females from 15 countries and males from 10 ended up with lower life expectancy at birth in 2020 than in 2015.

Author(s): José Manuel Aburto, Jonas Schöley, Ilya Kashnitsky, Luyin Zhang, Charles Rahal, Trifon I Missov, Melinda C Mills, Jennifer B Dowd, Ridhi Kashyap

Publication Date: 26 Sept 2021

Publication Site: International Journal of Epidemiology

Covid-19: Life expectancy is down but what does this mean?

Link:https://www.bbc.com/news/health-58659717

Graphic:

Excerpt:

Despite the name, these life expectancy figures, known as “period life expectancy”, do not predict an actual lifespan.

Instead, they show the average age a newborn would live to if current death rates continued for their whole life.

And as Covid death rates are unlikely to continue long-term, the new estimates do not mean a boy born in 2020 will have a shorter life than one born in 2019.

But they do provide a snapshot of the effect of the pandemic that can be compared over time and between countries and different populations.

Author(s): Christine Jeavans

Publication Date: 23 Sept 2021

Publication Site: BBC

Mega trend 10: The democratization of longevity

Link: https://www.clubvita.us/news-and-insights/mega-trend-10-the-democratization-of-longevity

Graphic:

Excerpt:

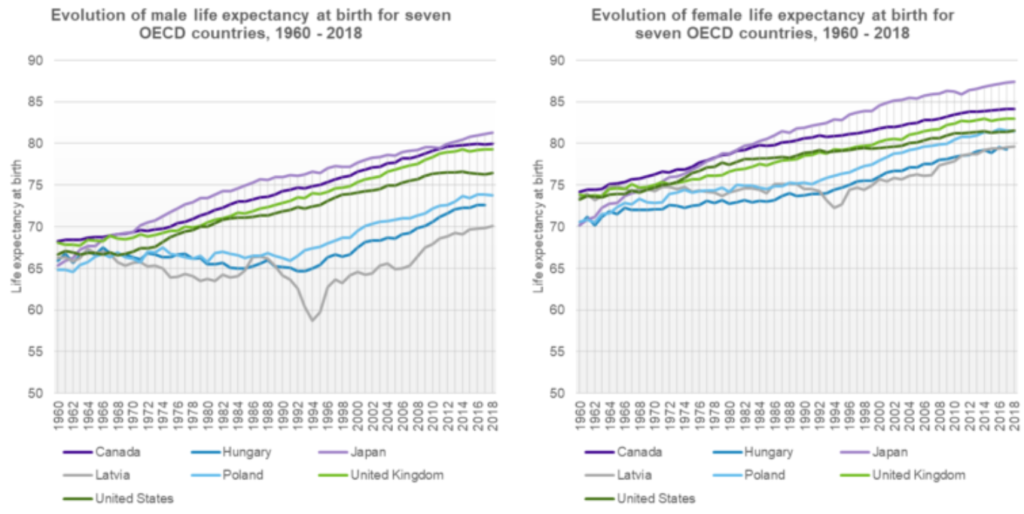
Illustrated below is the evolution of life expectancy at birth for seven Organization for Economic Co-operation and Development (OECD) countries: Canada, Hungary, Japan, Latvia, Poland, the United Kingdom, and the United States. Across the seven countries, male life expectancy at birth ranged from 64.8 years to 68.2 years in 1960, and 69.8 years to 81.1 years in 2017, demonstrating an increase in the inequality of life expectancy of almost eight years between these countries over the period. For females, the increase was approximately four years. The inequality in life expectancy is more apparent and unsettling if we consider, for example, developing countries in Africa, averaging a life expectancy of around 63 years in 2019.

….

Altogether, I believe greater democratization of longevity is achievable with the adoption of health technologies, while ensuring they are accessible and affordable. I am hopeful but I see several challenges ahead. Such a reality will be reliant on governments, health care professionals, and patients’ acceptance and reliance on what the future of health holds. It will also require global partnerships to build out ecosystems that will facilitate inclusive innovation.

Author(s): Shantel Aris

Publication Date: 22 Sept 2021

Publication Site: Club Vita

Spanish flu v. COVID-19: Comparing the Numbers and Forgetting the Lessons

Link: https://marypatcampbell.substack.com/p/spanish-flu-v-covid-19-comparing

Graphic:

Excerpt:

So, period life expectancy dropped about 12 – 13% in 1918 in the U.S., mainly due to the Spanish flu, because there was an outsized effect from young adults being the main group killed by the disease (also, period life expectancy was relatively short — under 60 years!). That was a drop of about 7 years.

But life expectancy dropped only about 1 year in 2020 due to COVID impacts, and that was a decrease of less than 3% compared to 2019.

So if you want to compare the effect of the Spanish flu vs. COVID-19 on the U.S. population, all of these rates —- percentage change in period life expectancy, age-adjusted death rates, or even crude death rate — are all more reasonable choices than simply number of people who died.

Author(s): Mary Pat Campbell

Publication Date: 22 Sept 2021

Publication Site: STUMP at substack