Japan PM says country on the brink over falling birth rate

Link: https://www.bbc.com/news/world-asia-64373950

Excerpt:

Japan’s prime minister says his country is on the brink of not being able to function as a society because of its falling birth rate.

Fumio Kishida said it was a case of “now or never.”

Japan – population 125 million – is estimated to have had fewer than 800,000 births last year. In the 1970s, that figure was more than two million.

Birth rates are slowing in many countries, including Japan’s neighbours.

But the issue is particularly acute in Japan as life expectancy has risen in recent decades, meaning there are a growing number of older people, and a declining numbers of workers to support them.

Japan now has the world’s second-highest proportion of people aged 65 and over – about 28% – after the tiny state of Monaco, according to World Bank data.

Author(s): George Wright

Publication Date: 23 Jan 2023

Publication Site: BBC

Reductions in US life expectancy during the COVID-19 pandemic by race and ethnicity: Is 2021 a repetition of 2020?

Link: https://www.ncbi.nlm.nih.gov/pmc/articles/PMC9432732/

Graphic:

Abstract:

COVID-19 had a huge mortality impact in the US in 2020 and accounted for most of the overall reduction in 2020 life expectancy at birth. There were also extensive racial/ethnic disparities in the mortality impact of COVID-19 in 2020, with the Black and Latino populations experiencing reductions in life expectancy at birth over twice as large as that of the White population. Despite continued vulnerability of these populations, the hope was that widespread distribution of effective vaccines would mitigate the overall mortality impact and reduce racial/ethnic disparities in 2021. In this study, we quantify the mortality impact of the COVID-19 pandemic on 2021 US period life expectancy by race and ethnicity and compare these impacts to those estimated for 2020. Our estimates indicate that racial/ethnic disparities have persisted, and that the US population experienced a decline in life expectancy at birth in 2021 of 2.2 years from 2019, 0.6 years more than estimated for 2020. The corresponding reductions estimated for the Black and Latino populations are slightly below twice that for Whites, suggesting smaller disparities than those in 2020. However, all groups experienced additional reductions in life expectancy at birth relative to 2020, and this apparent narrowing of disparities is primarily the result of Whites experiencing proportionately greater increases in mortality in 2021 compared with the corresponding increases in mortality for the Black and Latino populations in 2021. Estimated declines in life expectancy at age 65 increased slightly for Whites between 2020 and 2021 but decreased for both the Black and Latino populations, resulting in the same overall reduction (0.8 years) estimated for 2020 and 2021.

Author(s): Theresa Andrasfay, Noreen Goldman

Publication Date: 31 Aug 2022

Publication Site: PLOS ONE

Citation: Andrasfay T, Goldman N. Reductions in US life expectancy during the COVID-19 pandemic by race and ethnicity: Is 2021 a repetition of 2020? PLoS One. 2022 Aug 31;17(8):e0272973. doi: 10.1371/journal.pone.0272973. PMID: 36044413; PMCID: PMC9432732.

Two Key Takeaways From The New CDC Life Expectancy Data

Link: https://www.forbes.com/sites/ebauer/2022/09/02/two-key-takeaways-from-the-new-cdc-life-expectancy-data/?sh=6ce149f31cfc

Excerpt:

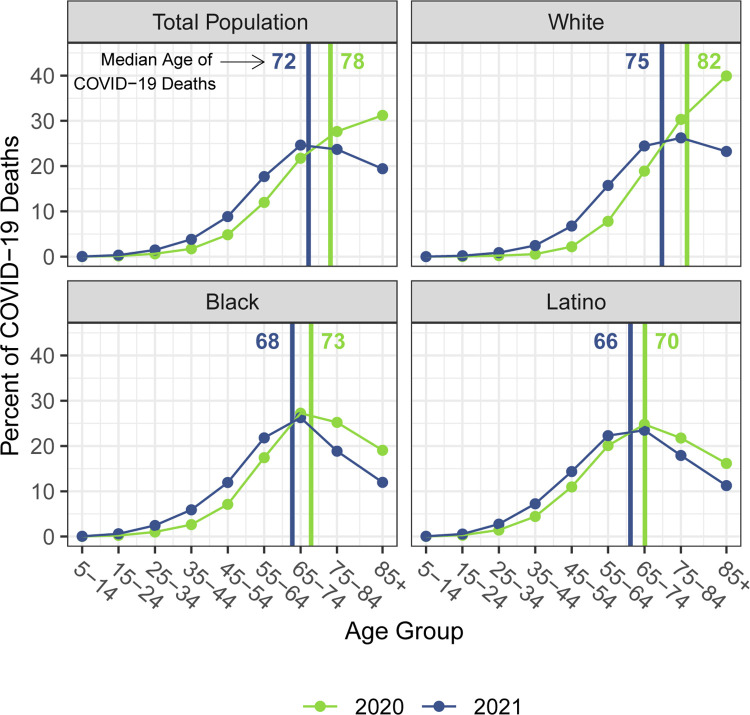
To what extent, are these drops of life expectancy due to Covid-19, rather than other causes?

From 2019 to 2020, the CDC reports that 90% of the drop in Hispanic life expectancy was attributable to Covid; the corresponding rates were 68% for whites and 59% for blacks. (No breakdown was provided for the AIAN or Asian categories.) However, the CDC data splits its breakdowns into “contributions to decreases” and “contributions to increases” rather than overall net effect. Those readers who are used to looking at data and charts will expect a “waterfall” style chart; the CDC version is not this, and is not particularly helpful.

In any event, relative to the 2020 baseline, the further decreases in life expectancy during 2021 had multiple causes. Only among the White demographic group was Covid the cause of over half of the decline; unintentional injury (including overdoses) was the second-largest contributing factor and for the AIAN demographic group, worsening rates of death due to chronic liver disease and cirrhosis played almost as substantial a role.

And, finally, it is important to understand that the CDC data shows a continued improvement in life expectancy due to reductions in death due to such causes as influenza/pneumonia, COPD/emphysema, Alzheimer disease, diabetes, and perinatal conditions (infant deaths). In fact, strikingly, in 2021, heart disease was a contributor to increased life expectancy in the Black, Hispanic, and Asian demographic groups, but a contributor to decreased life expectancy for the White and AIAN groups.

Again, though, the way the CDC provides its information means that, when it comes down to it, there is much that is simply missing; we do not know the magnitude of the improvements in life expectancy due to these causes, just that it exists. It even seems likely, or at least possible, that some of the apparent improvement in mortality due to these factors was actually because deaths were actually recorded as Covid deaths instead (whether due to multiple causes of death or other reasons).

Author(s): Elizabeth Bauer

Publication Date: 2 Sept 2022

Publication Site: Forbes
COVID-19 and the Short-Term Impact on Future U.S. Mortality

Link: https://www.soa.org/resources/research-reports/2022/covid-19-short-term-impact-us-mort/

PDF of report: https://www.soa.org/4a28d8/globalassets/assets/files/resources/research-report/2022/covid-19-short-term-impact-us-mort-report.pdf

Graphic:

Excerpt:

Excess mortality is expected to occur for all years studied with amounts varying by year and age.
Although the largest mortality excess numbers for the U.S. general population are foreseen for
2022, excess mortality is expected to decline each year so that by 2030, excess mortality numbers
are nearing expected levels. For 2030, mortality is projected to be 2% higher than expected for all
ages except age 85. At this age, 2030 projected mortality is estimated to be 1% higher than
expected.

Based on the average of the participants, generally, the amount of mortality excess is anticipated to be highest at the younger ages. For example, for 2022, projected mortality is anticipated to be 14% higher
compared to expected levels for age 25, 13% higher for age 45, and 10% higher for ages 65 and 85.

Author(s): Ronora Stryker, ASA, MAAA

Publication Date: August 2022

Publication Site: Society of Actuaries

Missing Americans: Early Death in the United States, 1933-2021

Link: https://www.medrxiv.org/content/10.1101/2022.06.29.22277065v1.full

Graphic:

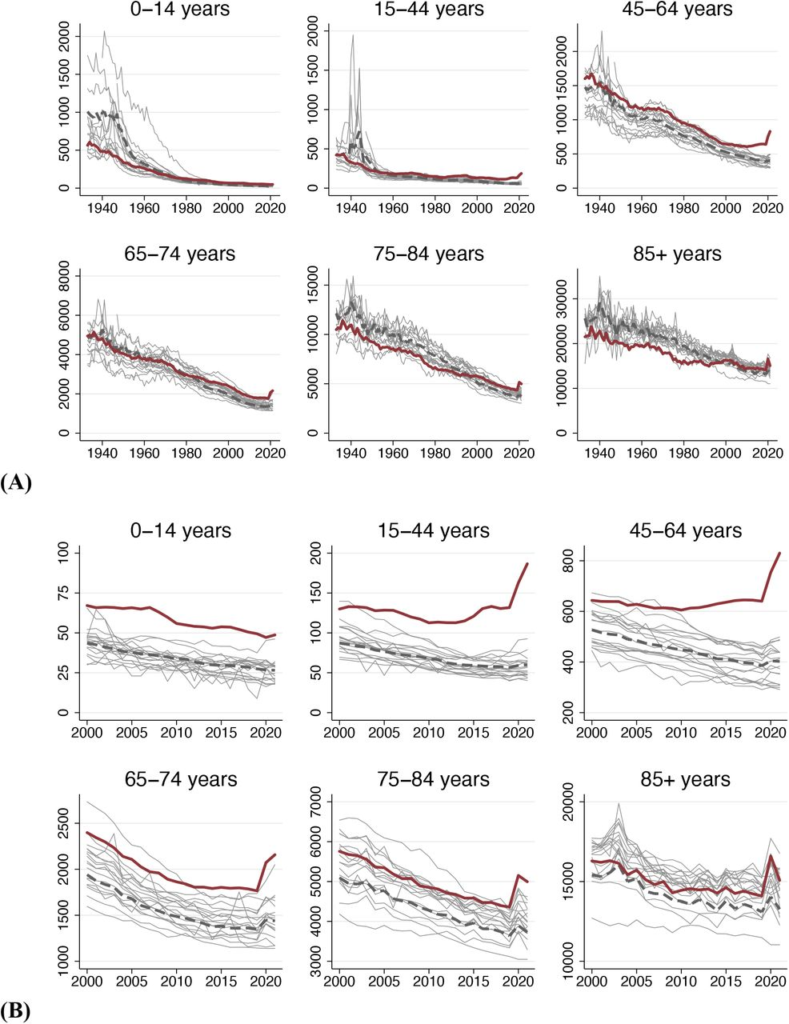
Age-specific mortality trends in the U.S. and other wealthy nations.Source: Human Mortality Database. Note: Figure shows deaths per 100K population, (A) 1933-2021 and (B) 2000-2021. Dark red line is U.S.; pink line is population-weighted average of other wealthy nations; grey lines are country-specific trends for other countries.

Excerpt:

We assessed how many U.S. deaths would have been averted each year, 1933-2021, if U.S. age-specific mortality rates had equaled those of other wealthy nations. The annual number of excess deaths in the U.S. increased steadily beginning in the late 1970s, reaching 626,353 in 2019. Excess deaths surged during the COVID-19 pandemic. In 2021, there were 1,092,293 “Missing Americans” and 25 million years of life lost due to excess mortality relative to peer nations. In 2021, half of all deaths under 65 years and 91% of the increase in under-65 mortality since 2019 would have been avoided if the U.S. had the mortality rates of its peers. Black and Native Americans made up a disproportionate share of Missing Americans, although the majority were White.

One sentence summary In 2021, 1.1 million U.S. deaths – including 1 in 2 deaths under age 65 years – would have been averted if the U.S. had the mortality rates of other wealthy nations.

Author(s):

Jacob Bor, View ORCID ProfileAndrew C. Stokes, Julia Raifman, Atheendar Venkataramani, Mary T. Bassett, David Himmelstein, Steffie Woolhandler


doi: https://doi.org/10.1101/2022.06.29.22277065

Publication Date: 30 Jun 2022

Publication Site: MedRXiV

A Widening Gap in Life Expectancy Makes Raising Social Security’s Retirement Age a Particularly Bad Deal for Low-Wage Earners

Link: https://sections.soa.org/publication/?m=58953&i=668685&view=articleBrowser&article_id=3731911&ver=html5

Graphic:

Excerpt:

Many recent studies find the life expectancy gap is growing. By how much depends on how and when it’s measured. In 2014, the Congressional Budget Office (CBO) calculated that a 65-yearold man in the upper quintile (fifth) of life earnings could be expected to live more than three years longer than a similar man in the lowest quintile. By 2039, the difference would double to six years.

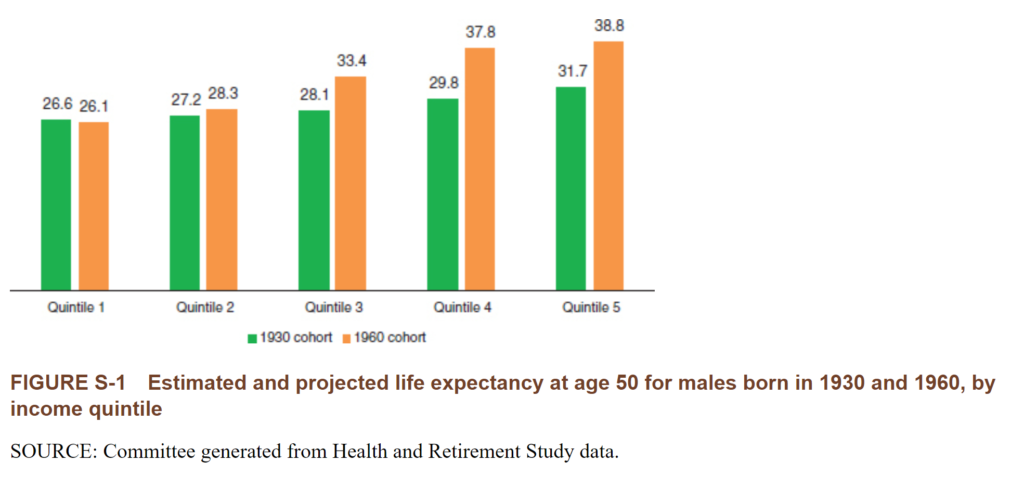
In a 2015 report, the National Academy of Sciences compared the 1930 and 1960 birth cohorts and found that life expectancy for the bottom quintile of men at age 50 decreased slightly to 26.1 years over the 30-year period. Meanwhile, life expectancy rose for men age 50 in higher-income quintiles. As shown in Figure 1, the life expectancy gap between the bottom (quintile 1) and top fifth of the income distribution widened from 5.1 to 12.7 years. In 2016, a Brookings study found, for men born in 1940, those in the lowest income decile at age 50 could expect to live to be about 76 years old compared with 88 years for the highest income decile. Another research team, led by Raj Chetty, found that disparity in longevity continued to increase over 2001–2014; the average gap between the bottom and top 1 percent was 14.6 years for men and 10.1 years for women.

Author(s): Karl Polzer

Publication Date: August 2020

Publication Site: In the Public Interest, SOA

2021 U.S. Mortality News Explainer: Life Expectancy, Death Rates, and More

Link:https://marypatcampbell.substack.com/p/2021-us-mortality-news-explainer?s=w

Graphic:

Excerpt:

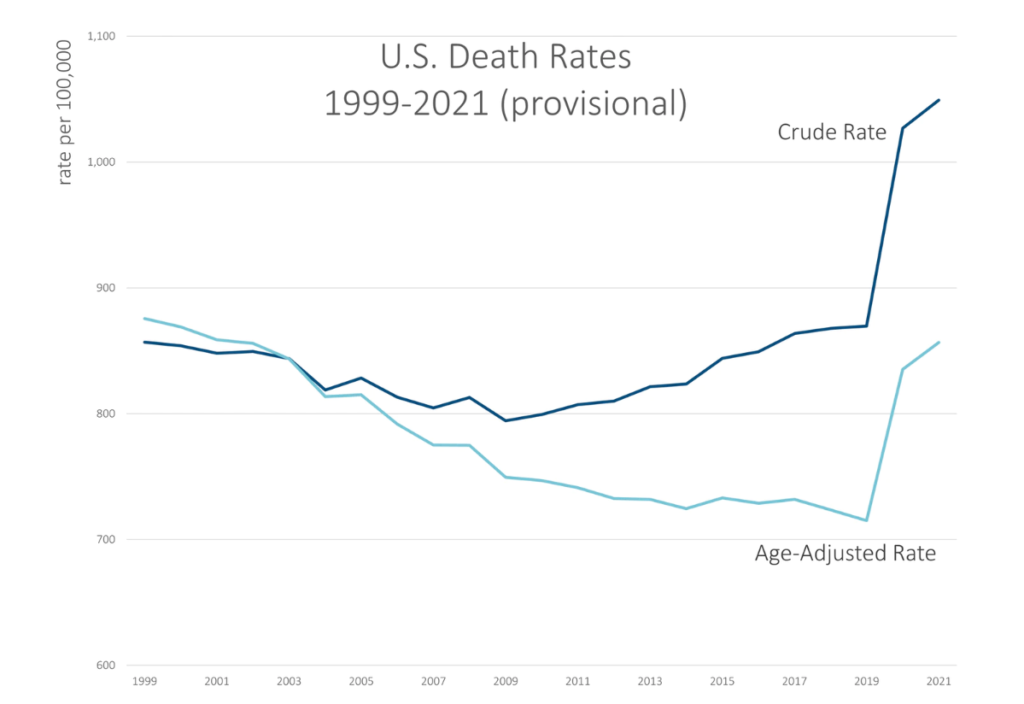
Here’s a graph for 1999 through the provisional 2021 result (as of 3 April 2022 data from CDC WONDER):

You can see the crude rate is higher than the age-adjusted rate for most of the years, and that’s due to the aging of the population. Basically, the Boomers have been getting older, and their older ages (and higher mortality compared to where they were in 2000), have an effect on how many deaths there are overall — thus the crude rate continually increasing as there are more and more old people.

However, until the pandemic hit, the age-adjusted death rate in general decreased, though we had a few years in the 2010s in which the age-adjusted death rate did increase… and yes, that was due to drug overdoses. We will get to that in a bit.

In any case, both the crude rate and age-adjusted rates did jump up by a lot in 2020 due to the pandemic, and COVID deaths were even higher in 2021. But there were other causes of death also keeping mortality rates high in 2021.

I will point out that even with all this extra mortality, the age-adjusted death rate in 2021 is still below where it was in 1999.

That does not mean things are hunky-dory.

This is one of the dangers of collapsing death rates into a single number. The increase in death rates has differed by age group, and it has been far worse for teens and young adults through even young middle-age than it has been for the oldest adults.

Yes, COVID has killed the oldest adults the most, but their death rates have increased the least. It’s all relative.

Author(s): Mary Pat Campbell

Publication Date: 13 Apr 2022

Publication Site: STUMP at substack

Mortality Angle of the Russian/Ukrainian Conflict: Bad Even Before Pandemic

Link: https://marypatcampbell.substack.com/p/mortality-angle-of-the-russianukrainian?s=w

Graphic:

Excerpt:

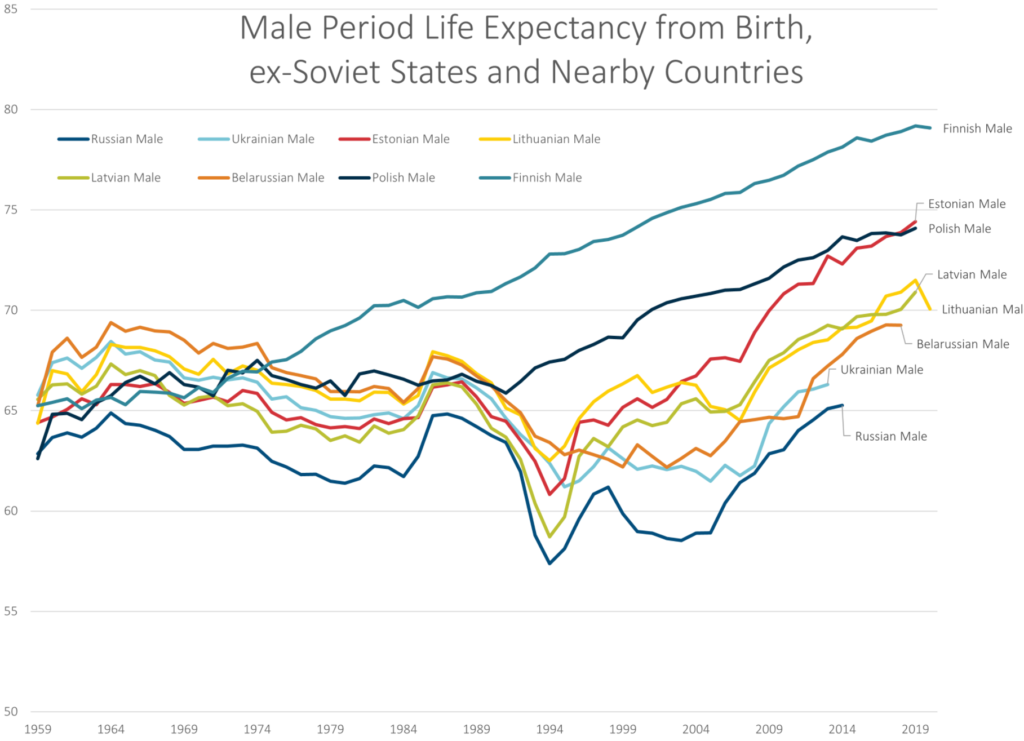
It may not be fair to throw Finland in there, but if the excuse is hard-drinking and being northerly, Finland has that in excess, and they are beating all those other countries in life expectancy. So that’s not the difference.

Note that all the ex-Soviet states except Russia and Ukraine also had the post-USSR fall from 1989-1994… but started their mortality improvement in 1994, as opposed to a decade later.

Poland started doing well the moment communism went away. Isn’t that interesting?

But I want to note that Ukraine and Russia are lagging the comparable countries hugely. To be sure, Russia is huge, and includes Siberia, which is not the most congenial of locations. But Ukraine doesn’t have the excuse of Siberia.

Both places, in short, suck when it comes to mortality.

Author(s): Mary Pat Campbell

Publication Date: 27 Feb 2022

Publication Site: STUMP at substack

9 Ways to Strengthen Social Security

Link: https://www.aarp.org/retirement/social-security/info-2022/benefits-current-status-future-stability.html

Graphic:

Excerpt:

How did we get here? ​​As long predicted, demographics explain a good deal: In a decade, the entirety of the boomer generation — some 70 million Americans born between 1946 and 1964 — will have hit retirement age. As a result, the number of people receiving Social Security benefits come 2034 will be more than double the beneficiaries in 1985. ​​

But what wasn’t known as accurately was how much longer those boomers would live. “From 1940 to 2019, life expectancies at age 65 have increased by about 6.5 years,” says Amy Kemp, chair of the Social Security Committee of the American Academy of Actuaries.

The impact: Many workers will be receiving benefits for a longer period of time. And those with higher incomes, which are generally those who receive higher benefit amounts, tend to live longer on average. ​

Author(s): John Waggoner

Publication Date: 1 March 2022

Publication Site: AARP

Mortality Angle of the Russian/Ukrainian Conflict: Bad Even Before Pandemic

Link: https://marypatcampbell.substack.com/p/mortality-angle-of-the-russianukrainian?utm_source=url

Graphic:

Excerpt:

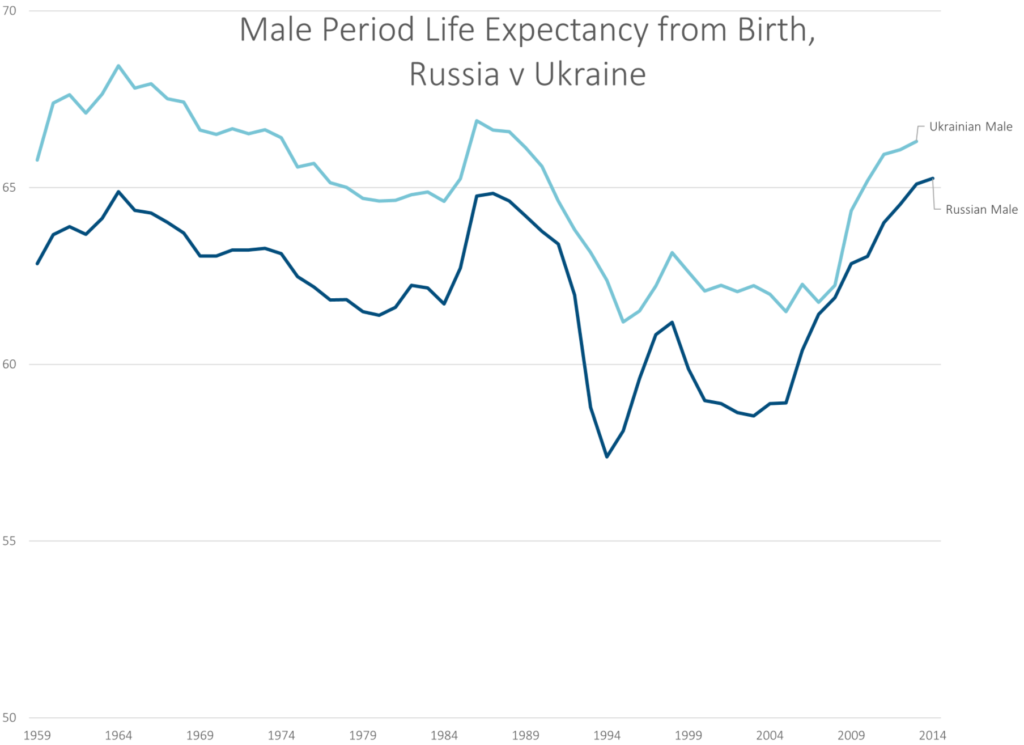
These are awful trends. There’s nothing to caveat. Yes, Ukraine’s life expectancy is a little bit higher, but these numbers are awful, and yes, there was a cratering of male life expectancy after the collapse of the Soviet Union.

I will note that there was a general slide from the early 1960s until the early 1980s… a run-up for some reason (falsifying data?), and then absolute cratering. That’s just hideous.

Dropping about 5 years over a 5-year period is a horrible decrease.

There has been a recovery since 2004, but that life expectancy is still very low compared to other European countries, even other Eastern European countries, as we’ll see below.

Author(s): Mary Pat Campbell

Publication Date: 27 Feb 2022

Publication Site: STUMP at substack

2021 Academy Legislative/Regulatory Review

Link: https://www.actuary.org/sites/default/files/members/alerts/pdf/2022/2022-CP-1.pdf

Excerpt:

The American Academy of Actuaries presents this summary of select significant regulatory and
legislative developments in 2021 at the state, federal, and international levels of interest to the U.S.
actuarial profession as a service to its members.

Introduction

The Academy focused on key policy debates in 2021 regarding pensions and retirement, health, life,
and property and casualty insurance, and risk management and financial reporting.


Responding to the COVID-19 pandemic, addressing ever-changing cyber risk concerns, and analyzing
the implications and actuarial impacts of data science modeling continued to be a focus in 2021.


Practice councils monitored and responded to numerous legislative developments at the state, federal,
and international level. The Academy also increased its focus on the varied impacts of climate risk and
public policy initiatives related to racial equity and unfair discrimination in 2021.


The Academy continues to track the progress of legislative and regulatory developments on actuarially
relevant issues that have carried over into the 2022 calendar year.

Publication Date: 15 Feb 2022

Publication Site: American Academy of Actuaries

American Academy of Actuaries: Some Estimates of Pandemic-Related Life Expectancy Changes Can Be Misleading

Link: https://www.prnewswire.com/news-releases/american-academy-of-actuaries-some-estimates-of-pandemic-related-life-expectancy-changes-can-be-misleading-301481737.html

Excerpt:

The American Academy of Actuaries has released a new public policy paper and issue brief cautioning that clarification may be needed regarding estimated life expectancy showing significant decreases in light of the COVID-19 pandemic.

“Reports of considerable decreases in life expectancy driven by COVID-19 may certainly garner attention, but they can potentially be misleading when based on a technical measure that assumes heightened pandemic mortality will persist indefinitely,” said Academy Senior Pension Fellow Linda K. Stone. “Service to the public is core to the American Academy of Actuaries’ mission, and we would be remiss not to share the actuarial profession’s expertise to help the public interpret such reports.”

The Academy’s new Essential Elements paper, Clarifying Misunderstanding of Life Expectancy and COVID-19, which is based on a December 2021 issue brief developed by the Academy’s Pension Committee, Interpreting Pandemic-Related Decreases in Life Expectancy, cites the potential of confusion arising from recent Centers for Disease Control and Prevention (CDC) estimates of significant life expectancy decreases primarily due to COVID-19. The CDC used a measurement known as “period life expectancy” to estimate life expectancy changes in 2020, publishing in July 2021 a preliminary estimate of a 1.5-year year-over-year decrease, and in December 2021 a final estimate of a 1.8-year decrease. However, the CDC’s methodology and the estimated decreases assume that the heightened mortality of the COVID-19 pandemic during the 2020 year will persist indefinitely—an unlikely scenario.

Author(s): American Academy of Actuaries

Publication Date: 14 Feb 2022

Publication Site: PRNEWSWIRE