Link: https://labs.minutelabs.io/survival-curves/#/
Graphic:
Excerpt:
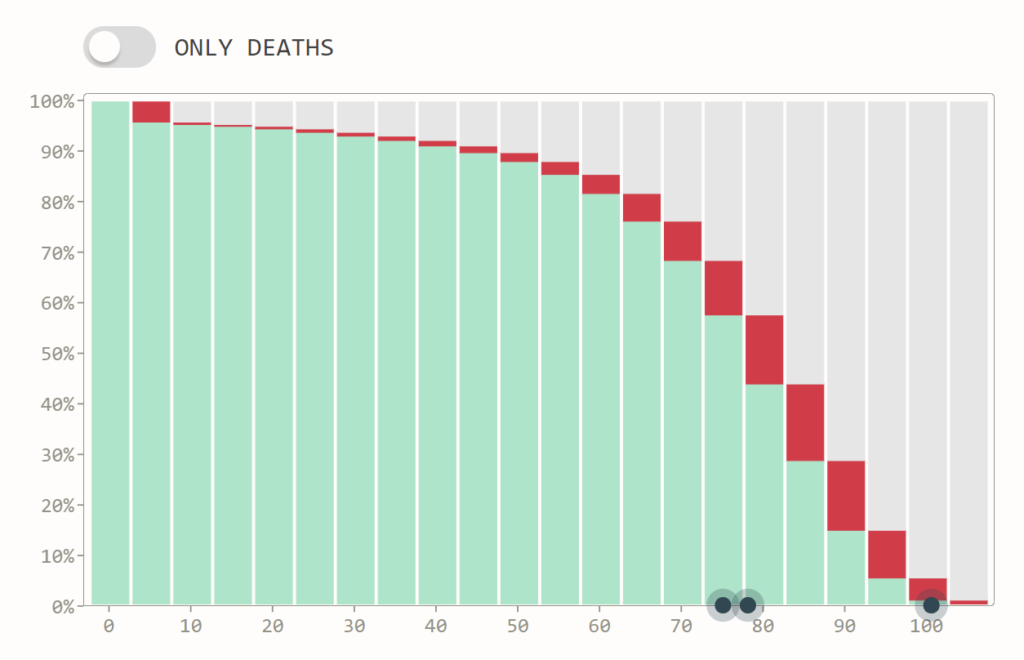
Every green block shows the fraction of individuals that are still alive when they reach that age. The red blocks show the fraction that died since the previous age group.
LIFE EXPECTANCY AT BIRTH
If we add up all the areas of the red blocks (deaths) and divide by 100%, we get the expected age an individual would die at (aka: life expectancy at birth). Humans mostly live around 75 years after birth.
Author(s): Jasper Palfree
Date Accessed: 15 March 2021
Publication Site: Minutelabs.io