A Widening Gap in Life Expectancy Makes Raising Social Security’s Retirement Age a Particularly Bad Deal for Low-Wage Earners

Link: https://sections.soa.org/publication/?m=58953&i=668685&view=articleBrowser&article_id=3731911&ver=html5

Graphic:

Excerpt:

Many recent studies find the life expectancy gap is growing. By how much depends on how and when it’s measured. In 2014, the Congressional Budget Office (CBO) calculated that a 65-yearold man in the upper quintile (fifth) of life earnings could be expected to live more than three years longer than a similar man in the lowest quintile. By 2039, the difference would double to six years.

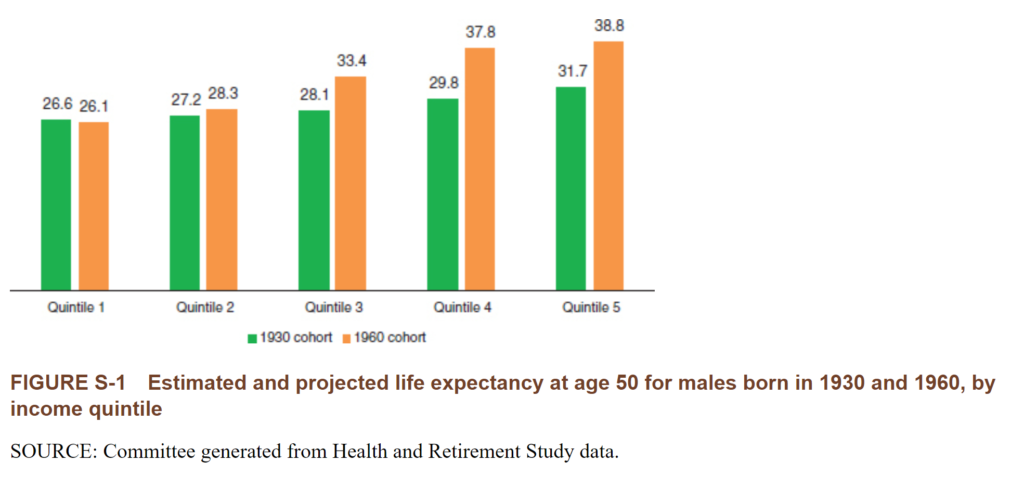
In a 2015 report, the National Academy of Sciences compared the 1930 and 1960 birth cohorts and found that life expectancy for the bottom quintile of men at age 50 decreased slightly to 26.1 years over the 30-year period. Meanwhile, life expectancy rose for men age 50 in higher-income quintiles. As shown in Figure 1, the life expectancy gap between the bottom (quintile 1) and top fifth of the income distribution widened from 5.1 to 12.7 years. In 2016, a Brookings study found, for men born in 1940, those in the lowest income decile at age 50 could expect to live to be about 76 years old compared with 88 years for the highest income decile. Another research team, led by Raj Chetty, found that disparity in longevity continued to increase over 2001–2014; the average gap between the bottom and top 1 percent was 14.6 years for men and 10.1 years for women.

Author(s): Karl Polzer

Publication Date: August 2020

Publication Site: In the Public Interest, SOA

Income Sources of Older Households: 2017

Link:https://www.census.gov/library/publications/2022/demo/p70br-177.html?utm_medium=email&utm_source=govdelivery

PDF: https://www.census.gov/content/dam/Census/library/publications/2022/demo/p70br-177.pdf

Graphic:

Excerpt:

This report examines older households’ sources of income, the amounts of this income, and how much each source of income contributes to total income. Older households receive income from a variety of sources, including social programs, private retirement savings, and earnings. Estimates from the 2018 Survey of Income and Program Participation (SIPP) show that in 2017, lower-income households relied on Social Security to a large degree, while higher-income households received a larger share of their income from private retirement savings and earnings. 

Author(s): DANIEL THOMPSON AND MICHAEL D. KING

Publication Date: Feb 2022

Publication Site: U.S. Census

Summary of the Latest Federal Income Tax Data, 2022 Update

Link: https://taxfoundation.org/summary-latest-federal-income-tax-data-2022-update?mc_cid=aeb8f14671&mc_eid=4737d05e09

Graphic:

Excerpt:

In 2019, taxpayers filed 148.3 million tax returns, reported earning nearly $11.9 trillion in adjusted gross income, and paid $1.6 trillion in individual income taxes.

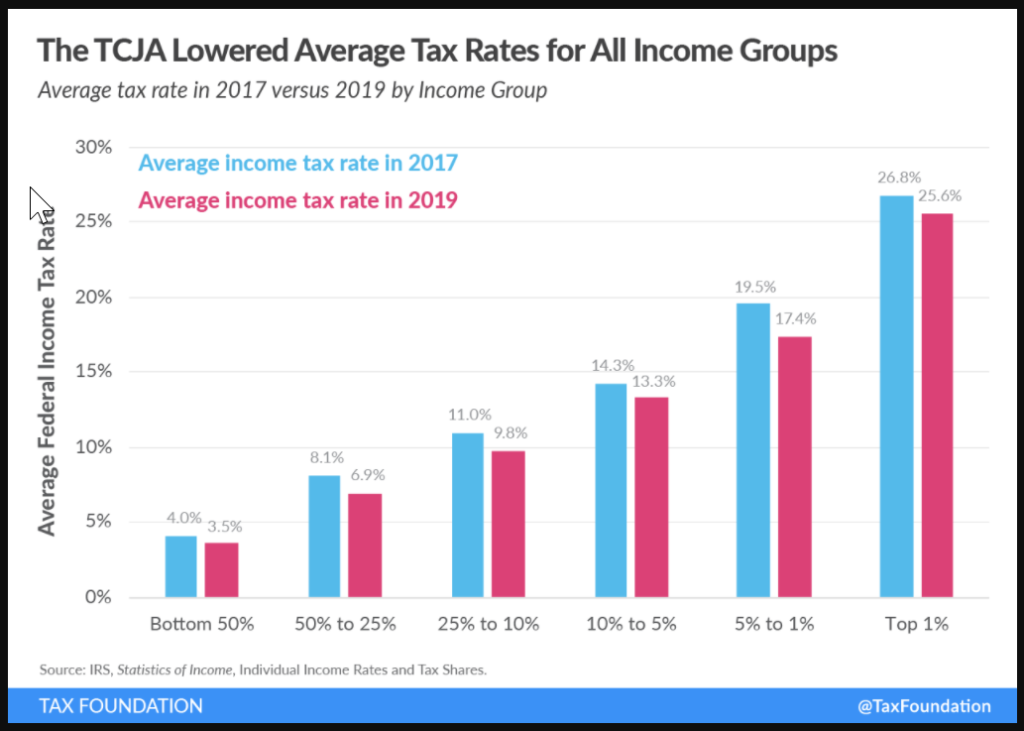
The top 1 percent of taxpayers paid a 25.6 percent average individual income tax rate, which is more than seven times higher than taxpayers in the bottom 50 percent (3.5 percent).

The share of reported income earned by the top 1 percent of taxpayers fell to 20.1 percent from 20.9 percent in 2018. The top 1 percent’s share of federal individual income taxes paid fell to 38.8 percent from 40.1 percent.

The top 50 percent of all taxpayers paid 97 percent of all individual income taxes, while the bottom 50 percent paid the remaining 3 percent.

The top 1 percent paid a greater share of individual income taxes (38.8 percent) than the bottom 90 percent combined (29.2 percent).

The Tax Cuts and Jobs Act reduced average tax rates across income groups.

Author(s): Erica York

Publication Date: 19 Jan 2022

Publication Site: Tax Foundation