Trends in Mandatory Spending

Link:https://crsreports.congress.gov/product/pdf/R/R44641

Graphic:

Excerpt:

In FY2023, mandatory spending accounts for an estimated 63% of total federal spending. Social Security alone accounts for about 21% of federal spending. Medicare and the federal share of Medicaid together account for another 25% of federal spending. Therefore, spending on Social Security, Medicare, and Medicaid now makes up almost half of total federal spending.

These figures do not reflect the implicit cost of tax expenditures, which are revenue losses attributable to provisions of the federal tax laws that allow a special exclusion, exemption, or deduction from gross income or provide a special credit, a preferential tax rate, or a deferral of tax liability.8 As with mandatory spending, tax policy is not controlled by annual appropriations acts, but by other types of legislation.

Author(s): Congressional Research Service

Publication Date: last updated 7 Nov 2023

Publication Site: U.S. Congress

The Sustainability of State & Local Pensions: A Public Finance Approach

Link: https://crr.bc.edu/briefs-state-local-pensions/the-sustainability-of-state-local-pensions-a-public-finance-approach/

Graphics:

Key findings:

  • Many experts favor full prefunding of state and local pensions to maintain fiscal sustainability, which means big contribution hikes.
  • This analysis explores an alternative: stabilizing pension debt as a share of GDP.
  • Under current contribution rates, baseline projections show no sign of a major crisis in the next two decades even if asset returns are low.
  • Yet, many plans will be at risk over the long term of exhausting their assets, so action will be needed.
  • Plans can reach a sustainable footing by stabilizing their debt-to-GDP ratio, with much smaller contribution hikes than under full funding.

Author(s): Louise Sheiner

Publication Date: 11 April 2023

Publication Site: Center for Retirement Research at Boston College

Gross Domestic Product, Third Quarter 2022 (Advance Estimate)

Link: https://www.bea.gov/news/2022/gross-domestic-product-third-quarter-2022-advance-estimate

Graphic:

Excerpt:

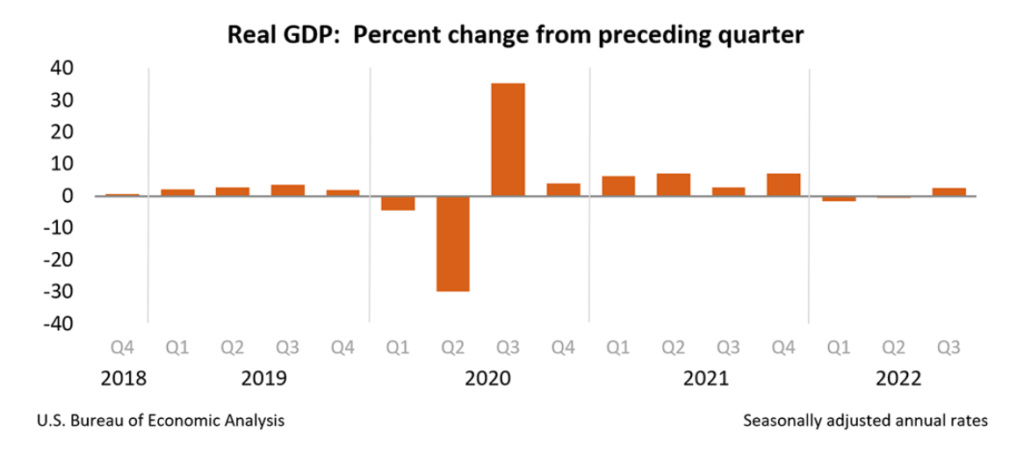
Real gross domestic product (GDP) increased at an annual rate of 2.6 percent in the third quarter of 2022 (table 1), according to the “advance” estimate released by the Bureau of Economic Analysis. In the second quarter, real GDP decreased 0.6 percent.

The GDP estimate released today is based on source data that are incomplete or subject to further revision by the source agency (refer to “Source Data for the Advance Estimate” on page 3). The “second” estimate for the third quarter, based on more complete data, will be released on November 30, 2022.

The increase in real GDP reflected increases in exports, consumer spending, nonresidential fixed investment, federal government spending, and state and local government spending, that were partly offset by decreases in residential fixed investment and private inventory investment. Imports, which are a subtraction in the calculation of GDP, decreased (table 2).

Publication Date: 27 Oct 2022

Publication Site: Bureau of Economic Analysis

Business Cycle Dating Procedure: Frequently Asked Questions

Link: https://www.nber.org/business-cycle-dating-procedure-frequently-asked-questions

Excerpt:

Q: The financial press often states the definition of a recession as two consecutive quarters of decline in real GDP. How does that relate to the NBER’s recession dates?

A: Most of the recessions identified by our procedures do consist of two or more consecutive quarters of declining real GDP, but not all of them. In 2001, for example, the recession did not include two consecutive quarters of decline in real GDP. In the recession from the peak in December 2007 to the trough in June 2009, real GDP declined in the first, third, and fourth quarters of 2008 and in the first and second quarters of 2009. Real GDI declined for the final three quarters of 2001 and for five of the six quarters in the 2007–2009 recession.

Q: Why doesn’t the committee accept the two-quarter definition?

A: There are several reasons. First, we do not identify economic activity solely with real GDP, but consider a range of indicators. Second, we consider the depth of the decline in economic activity. The NBER definition includes the phrase, “a significant decline in economic activity.” Thus real GDP could decline by relatively small amounts in two consecutive quarters without warranting the determination that a peak had occurred. Third, our main focus is on the monthly chronology, which requires consideration of monthly indicators. Fourth, in examining the behavior of production on a quarterly basis, where real GDP data are available, we give equal weight to real GDI. The difference between GDP and GDI—called the “statistical discrepancy”—was particularly important in the recessions of 2001 and 2007–2009.

Author(s):

Publication Date: 19 July 2021 last updated, accessed 3 August 2022

Publication Site: NBER

Visualizing the Coming Shift in Global Economic Power (2006-2036p)

Link: https://www.visualcapitalist.com/shifting-global-economic-power/

Graphic:

Excerpt:

China is expected to surpass the U.S. by the year 2030. A faster than expected recovery in the U.S. in 2021, and China’s struggles under the “Zero-COVID” policies have delayed the country taking the top spot by about two years.

China has maintained its positive GDP growth due to the stability provided by domestic demand. This has proven crucial in sustaining the country’s economic growth. China’s fiscal and economic policy had focused on this prior to the pandemic over fears of growing Western trade restrictions.

Author(s): Raul Amoros

Publication Date: 13 Jun 2022

Publication Site: Visual Capitalist

Covid-19, Endemic or Not, Will Still Make Us Poorer

Link: https://www.wsj.com/articles/covid-19-endemic-or-not-will-still-make-us-poorer-11642608213

Excerpt:

Endemic Covid-19 could thus become a lasting “supply shock” that degrades how much economies can produce, similar to the surge in oil prices in the 1970s. In October, the International Monetary Fund estimated global output this year would still be 3% lower than it had projected in 2019, with Western Europe and Latin America showing much bigger hits than China and Japan, where Covid-19’s toll has been much lower.

The U.S. is an exception: Output in the last quarter of 2021 was roughly back to its pre-pandemic trend. But the economy, distorted and disrupted by Covid-19, is struggling to sustain this level of output, as the surge in inflation to 7% demonstrates.

Covid-19 might have boosted efficiency in some industries by speeding up digitization and adoption of remote work. Goldman Sachs economists estimate this delivered a 3% to 4% boost to U.S. productivity.

But some of the shift to remote operations is involuntary, and some of the rise in productivity might reflect an overworked workforce. Indeed, the pandemic has left the labor force smaller, sicker and less happy. Absences due to illness among employed workers have averaged 50% higher in the last two years. In early January, nearly 12 million people weren’t working because they were sick with Covid-19, caring for someone with coronavirus, or concerned about getting or spreading the disease, according to a regular Census Bureau survey. The figure hasn’t been below 4 million since June 2020.

In the past year, workers have reported declining satisfaction with their wages and a rising “reservation wage,” that is, how much they would have to be paid to accept a new job, according to the Federal Reserve Bank of New York. This might reflect inflation, changed expectations, or stress due to Covid-19 testing, masks and vaccine mandates, or their absence.

For employers, this makes it much harder to attract the necessary staff. Nursing homes have boosted hourly wages 14% since the start of the pandemic, yet staffing has plummeted 12%, impairing their ability to accept new patients. Such shortages impose a cost that doesn’t show up in gross domestic product.

Author(s): Greg Ip

Publication Date: 19 Jan 2022

Publication Site: WSJ

November 7-13, 1921

Link:https://roaring20s.substack.com/p/november-7-1921

Graphic:

Excerpt:

Companies ranging from Ford Motor Company to Union Pacific Railroad report substantially improved business activity for the month of October. The current recession may have ended in the summer. Aggregate bond purchases were the largest since one year ago as Americans finally start investing again. Opinion articles, however, advise against common stock and its gambling attributes.

Historical Fact: American and international investors will soon assume high GDP growth is a feature of the American economy, as God-given and laid down in the natural order as the seasons. At the end of 1921, however, it’s not yet clear elements are present for business revival.

Author(s): Tate

Publication Date: 7 Nov 2021

Publication Site: Roaring 20s on substack

Hutchins Center Fiscal Impact Measure

Graphic:

Excerpt:

Fiscal policy boosted U.S. GDP growth by 8.5 percentage points at an annual rate in the first quarter of 2021, the Hutchins Center Fiscal Impact Measure (FIM) shows. The FIM translates changes in taxes and spending at federal, state, and local levels into changes in aggregate demand, illustrating the effect of fiscal policy on real GDP growth. GDP rose at an annual rate of 6.4% in the first quarter, according to the government’s latest estimate.

The boost to economic growth in the first quarter from fiscal policy is largely the result of two rounds of rebate checks (the $600 per person from legislation enacted in December that was paid in January, and the $1,400 per person from the American Rescue Plan Act that was paid in the last few weeks of March). An uptick in purchases by the federal government, reflecting in part spending on vaccines and processing of Paycheck Protection Program loans, also boosted economic activity.

Author(s): Manuel Alcala Kovalski, Sophia Campbell, Tyler Powell, Louise Sheiner

Publication Date: 1 June 2021 (most recent data update)

Publication Site: Brookings

Not With a Bang, But a Whimper: Demographic Decline Undermines Public Finance

Link: https://marypatcampbell.substack.com/p/not-with-a-bang-but-a-whimper-demographic

Graphic:

Excerpt:

The last time the Census Bureau did a population projection, the estimated population for even 2020 came in a little high. From March 2018: Demographic Turning Points for the United States: Population Projections for 2020 to 2060 — they estimated a total population of about 332.6 million, and the apportionment Census results were 331.1 million. To be sure, this is a less than 0.5% difference, so no big deal.

This is the growth rate they projected, even in 2018:
2020-2030: 7%
2030-2040: 5%
2040-2050: 4%
2050-2060: 4%

Those are full-decade growth rates. That’s before the pandemic has shaved our numbers down a little.

Would you like to know the growth rates from prior decades?
2010-2020: 7%
2000-2010: 10%
1990-2000: 13%
1980-1990: 10%

Author(s): Mary Pat Campbell

Publication Date: 28 May 2021

Publication Site: STUMP at substack

Pandemic divergence: The social and economic costs of Covid-19

Link: https://voxeu.org/article/social-and-economic-costs-covid-19

Graphic:

Excerpt:

First, we compute the differences between the output paths for 2020–2030 projected before and after the pandemic (the shaded area in Figure 1) and estimate its present value discounting at a 0% real interest rate (a reasonably conservative assumption in a context where real rates are negative for most developed countries). This yields a total loss of about half of global GDP. 

Next, there is the question of the fiscal stimulus (equivalent to 15% of GDP, according to the IMF fiscal monitor) without which the output loss in 2020 would have been much steeper. How much of the economic impact of the fiscal unwinding is properly accounted for in the revised growth projections (Beck et al. 2021), particularly given that a big part of the stimulus (6% of the 15%) was below the line (loans, equity stakes, guarantees) with a cost that is contingent on the speed and composition of economic recovery in each country? There is no simple answer here. Moreover, we are ignoring potential bouts of financial stress or debt restructurings in heavily indebted countries (Persaud 2021), as well as the second wave of stimulus already in line for 2021 in many advanced economies. All things considered, adding the full 15% of GDP as an indicative measure of the cost of fiscal support does not look unreasonable. 

Third, there is the value of the excess deaths due to Covid-19. There is, of course, no uncontroversial way to put a value on human life. For the sake of argument, we follow a recent estimation for the US by Cutler and Summers (2020) that uses the ‘statistical lives’ value to place it between $10 million and $7 million per life. If we take the considerably more conservative $5 million per life, acknowledging that the statistical value may vary across countries, the cost related to the global cumulative deaths registered so far amounts to 16.9% of global GDP.

Author(s): Eduardo Levy Yeyati, Federico Filippini

Publication Date:

Publication Site: Vox EU

What history tells you about post-pandemic booms

Link: https://www.economist.com/finance-and-economics/2021/04/29/what-history-tells-you-about-post-pandemic-booms

Graphic:

Excerpt:

The record suggests that, after periods of massive non-financial disruption such as wars and pandemics, GDP does bounce back. It offers three further lessons. First, while people are keen to go out and spend, uncertainty lingers. Second, crises encourage people and businesses to try new ways of doing things, upending the structure of the economy. Third, as “Les Miserables” shows, political upheaval often follows, with unpredictable economic consequences.

Publication Date: 1 May 2021

Publication Site: The Economist

Don’t Mistake Accounting for Economics

Link: https://www.nationalreview.com/2021/04/dont-mistake-accounting-for-economics/

Excerpt:

There’s one mistake that’s particularly common and damaging. Too many observers try to derive economic principles from accounting principles. This is flat-out wrong. The reason is simple: Economics is not accounting. Economists try to understand the causal relationships in commerce and government. Accountants document stocks and flows in an orderly fashion. Economics obviously makes use of accounting, and accounting can be improved through knowledge of economics, but they’re not the same thing.

The most egregious abuses of economics that we see today start with an accounting identity — a true statement or equation — but end with an absurd economic claim. Importantly, an identity is true by construction. Based on the definitions of the variables, the formulation must be so. But it doesn’t say anything about the real world. It certainly doesn’t capture the causal relationships among those variables.

Author(s): Alexander William Salter

Publication Date: 9 April 2021

Publication Site: National Review