Link: https://www.medrxiv.org/content/10.1101/2022.06.29.22277065v1.full
Graphic:
Excerpt:
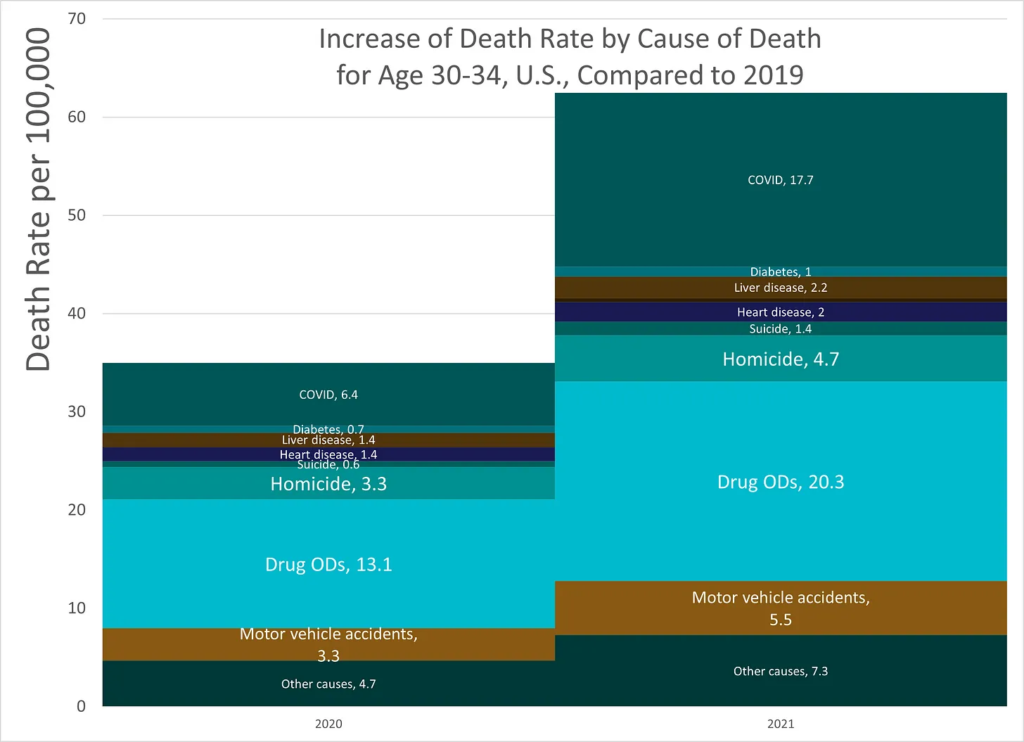
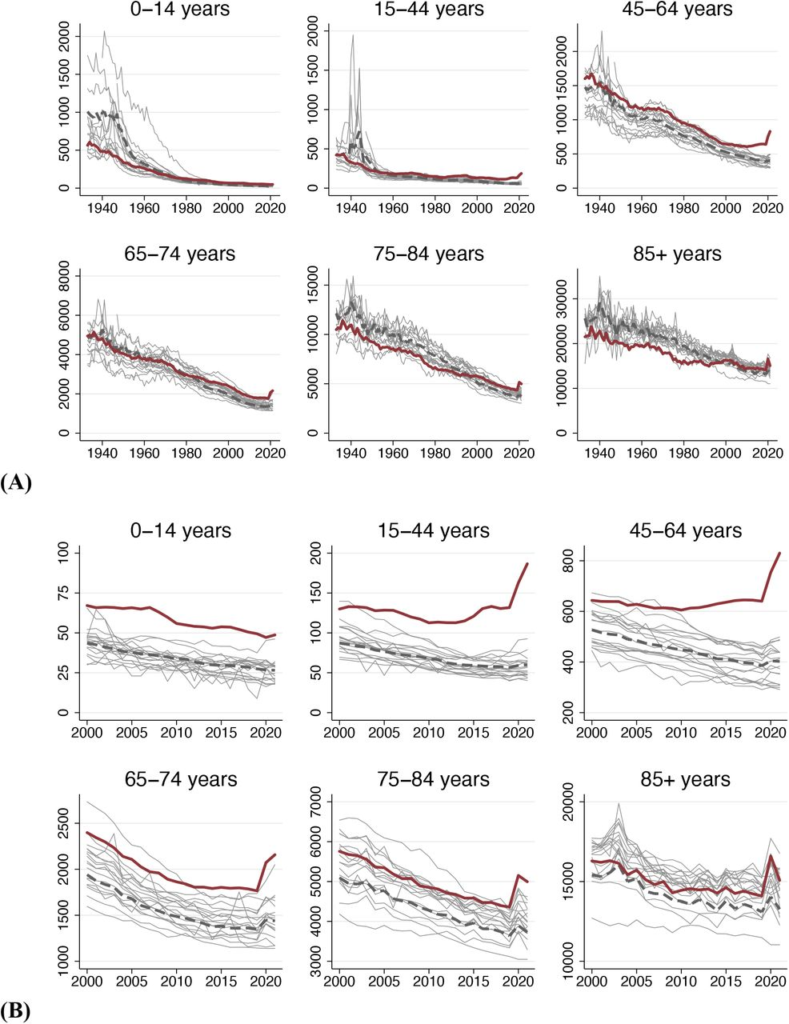
We assessed how many U.S. deaths would have been averted each year, 1933-2021, if U.S. age-specific mortality rates had equaled those of other wealthy nations. The annual number of excess deaths in the U.S. increased steadily beginning in the late 1970s, reaching 626,353 in 2019. Excess deaths surged during the COVID-19 pandemic. In 2021, there were 1,092,293 “Missing Americans” and 25 million years of life lost due to excess mortality relative to peer nations. In 2021, half of all deaths under 65 years and 91% of the increase in under-65 mortality since 2019 would have been avoided if the U.S. had the mortality rates of its peers. Black and Native Americans made up a disproportionate share of Missing Americans, although the majority were White.
One sentence summary In 2021, 1.1 million U.S. deaths – including 1 in 2 deaths under age 65 years – would have been averted if the U.S. had the mortality rates of other wealthy nations.
Author(s):
Jacob Bor, View ORCID ProfileAndrew C. Stokes, Julia Raifman, Atheendar Venkataramani, Mary T. Bassett, David Himmelstein, Steffie Woolhandler
doi: https://doi.org/10.1101/2022.06.29.22277065
Publication Date: 30 Jun 2022
Publication Site: MedRXiV