Video:
Author(s): Mary Pat Campbell
Publication Date: 27 February 2021
Publication Site: YouTube
All about risk
Video:
Author(s): Mary Pat Campbell
Publication Date: 27 February 2021
Publication Site: YouTube
Graphic:
Excerpt:
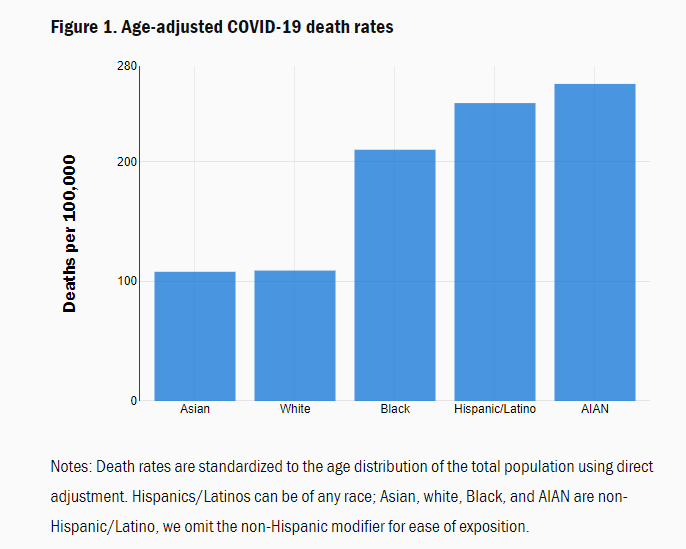
According to Centers for Disease Control (CDC) data, the age-adjusted COVID-19 mortality rate is now higher for AIAN people than for any other group (Figure 1); it is almost two and a half times the death rate for whites and Asians.[2] Figure 1 also shows that the disparities for Blacks and Hispanics/Latinos relative to whites, that we identified in June, remain substantial.[3] (That post also explains why it is important to adjust for age when comparing across groups.)
Author(s): Randall Akee and Sarah Reber
Publication Date: 18 February 2021
Publication Site: Brookings
Link: https://bmcpublichealth.biomedcentral.com/articles/10.1186/s12889-020-09335-8
Graphic:
Abstract:
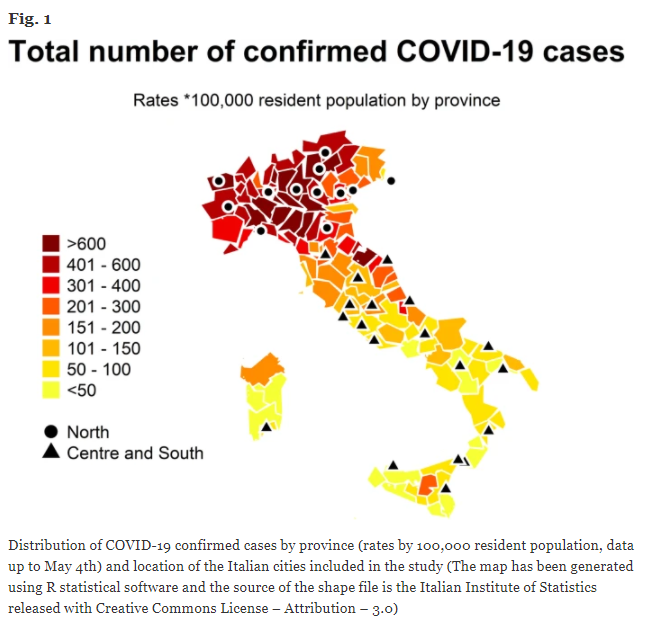
COVID-19 had a greater impact in northern Italian cities among subjects aged 75–84 and 85+ years. COVID-19 deaths accounted for half of total excess mortality in both areas, with differences by age: almost all excess deaths were from COVID-19 among adults, while among the elderly only one third of the excess was coded as COVID-19. When taking into account the mortality deficit in the pre-pandemic period, different trends were observed by area: all excess mortality during COVID-19 was explained by deficit mortality in the centre and south, while only a 16% overlap was estimated in northern cities, with quotas decreasing by age, from 67% in the 15–64 years old to 1% only among subjects 85+ years old.
Author(s): Paola Michelozzi, Francesca de’Donato, Matteo Scortichini, Patrizio Pezzotti, Massimo Stafoggia, Manuela De Sario, Giuseppe Costa, Fiammetta Noccioli, Flavia Riccardo, Antonino Bella, Moreno Demaria, Pasqualino Rossi, Silvio Brusaferro, Giovanni Rezza & Marina Davoli
Publication Date: 27 August 2020
Publication Site: BMC Public Health
Link: https://www.soa.org/resources/research-reports/2021/excess-deaths-gen-population/
Report link: https://www.soa.org/globalassets/assets/files/resources/research-report/2021/excess-deaths-gen-population.pdf
Graphic:
Excerpt:
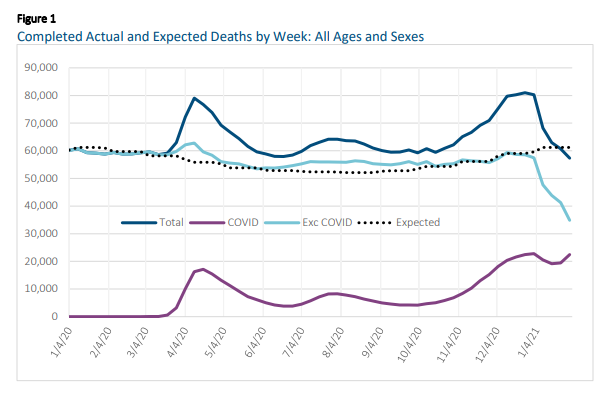
Excluding the first two and a half months of 2020 before COVID-19 deaths were prevalent, the total U.S. mortality A/E ratio ranged between 119% and 121%, with about 84% of the excess deaths identified as due to COVID-19. Considering the full year of 2020, the A/E ranged between 114% and 116%.
Deaths for people under age 15 were lower than expected, but all older ages showed excess mortality. The following table considers the A/E ratios for the period after the emergence of COVID-19 and uses a fiveyear trend on death rates by ages and sex to set the expected deaths.
Author(s): Rick Leavitt, ASA, MAAA
Publication Date: February 2021
Publication Site: Society of Actuaries
Excerpt:
The actual number of deaths for people of all ages has been 18.4% higher than the expected number.
For women, the worst actual-to-expected death ratio is for the 35-44 age group.
For men, the highest percentage of excess deaths was was for the 35-54 age group.
Author(s): Allison Bell
Publication Date: 25 February 2021
Publication Site: Think Advisor
Link: https://github.com/TheEconomist/covid-19-excess-deaths-tracker
Excerpt:
This repository contains the data behind The Economist’s tracker for covid-19 excess deaths and the code that we have used to clean, analyse and present the numbers.
….
Our tracker uses data from a number of statistical bureaus, government departments and academic projects. For many of the countries, we have imported
total_deathsfrom the Human Mortality Database, which collates detailed weekly breakdowns from official sources around the world. For other countries, you can find a full list of sources and links in a file calledlist_of_sources.csv, as well as spreadsheets in the/source-data/folder.For most countries, we have imported national figures on official
covid deathsfrom a time series maintained by Johns Hopkins University and Our World In Data. For some countries, we have provided a regional breakdown of mortality. In these cases, we have imported regionalcovid_deathsfrom a variety of sources, including a Latin American time series maintained by Data Science Research Peru.
Date accessed: 25 February 2021
Publication Site: github
Link: https://www.economist.com/graphic-detail/tracking-coronavirus-across-america
Graphic:
Excerpt:
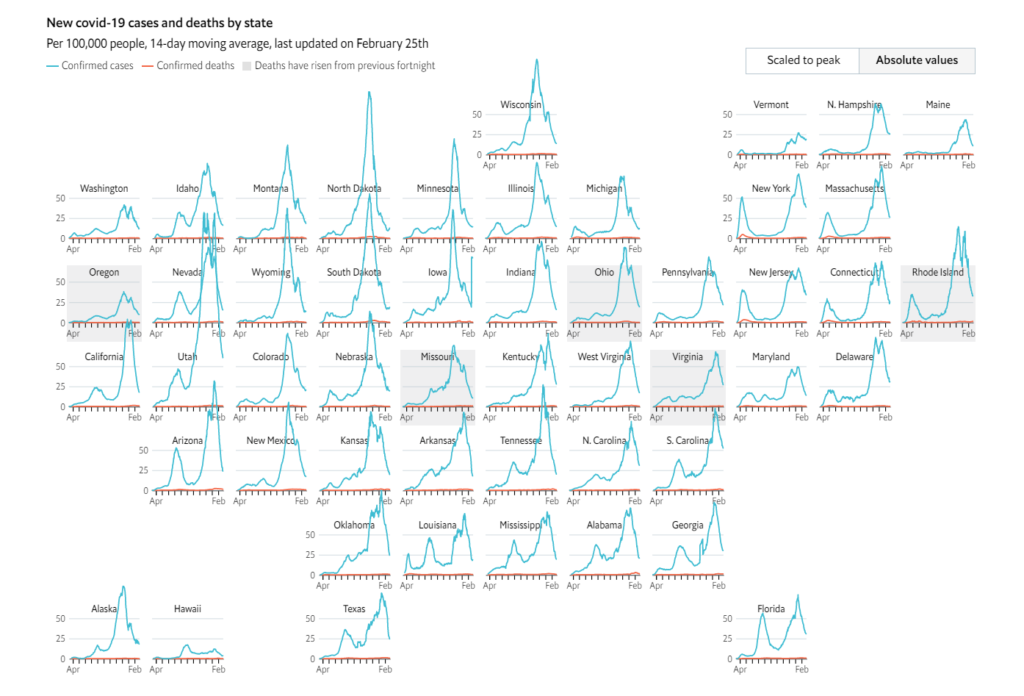
However, herd immunity will take months to achieve, and the sheer scale of infections in America dictates that covid-19 will not be under control for some time. In order to see where the pandemic is currently most severe across the nation, we have created an interactive map of covid-19 cases and deaths. It divides America into 500 areas. For each of these it shows cases and deaths per 100,000 people, so that infection and death rates in, say, New York City and its surrounds (population 40m) can be compared with those in Ironwood, Michigan (population 27,000).
Publication Date: 23 February 2021
Publication Site: The Economist
Link: https://www.economist.com/graphic-detail/coronavirus-excess-deaths-tracker
Graphic:
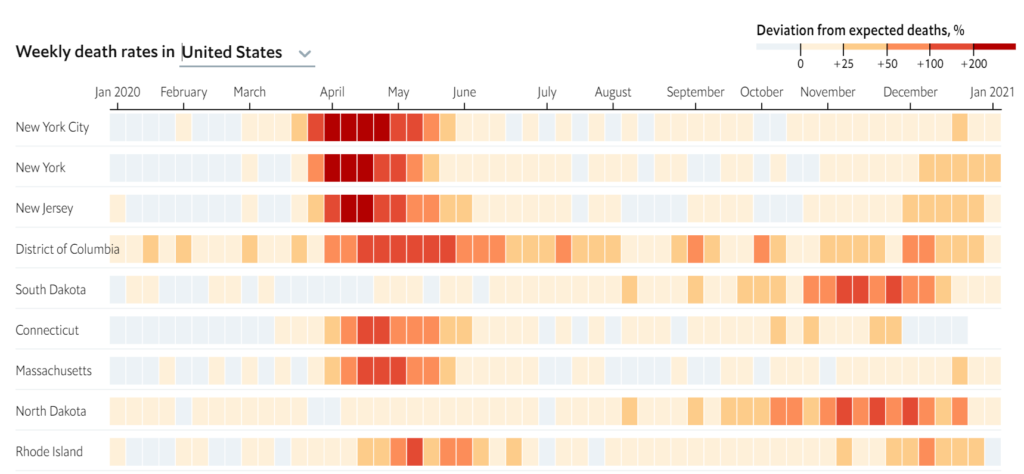
Excerpt:
As covid-19 has spread around the world, people have become grimly familiar with the death tolls that their governments publish each day. Unfortunately, the total number of fatalities caused by the pandemic may be even higher, for several reasons. First, the official statistics in many countries exclude victims who did not test positive for coronavirus before dying—which can be a substantial majority in places with little capacity for testing. Second, hospitals and civil registries may not process death certificates for several days, or even weeks, which creates lags in the data. And third, the pandemic has made it harder for doctors to treat other conditions and discouraged people from going to hospital, which may have indirectly caused an increase in fatalities from diseases other than covid-19.
One way to account for these methodological problems is to use a simpler measure, known as “excess deaths”: take the number of people who die from any cause in a given region and period, and then compare it with a historical baseline from recent years. We have used statistical models to create our baselines, by predicting the number of deaths each region would normally have recorded in 2020.
Date Accessed: 25 February 2021
Date last updated: 23 February 2021
Publication Site: The Economist
Link: https://github.com/dkobak/excess-mortality
Graphic:
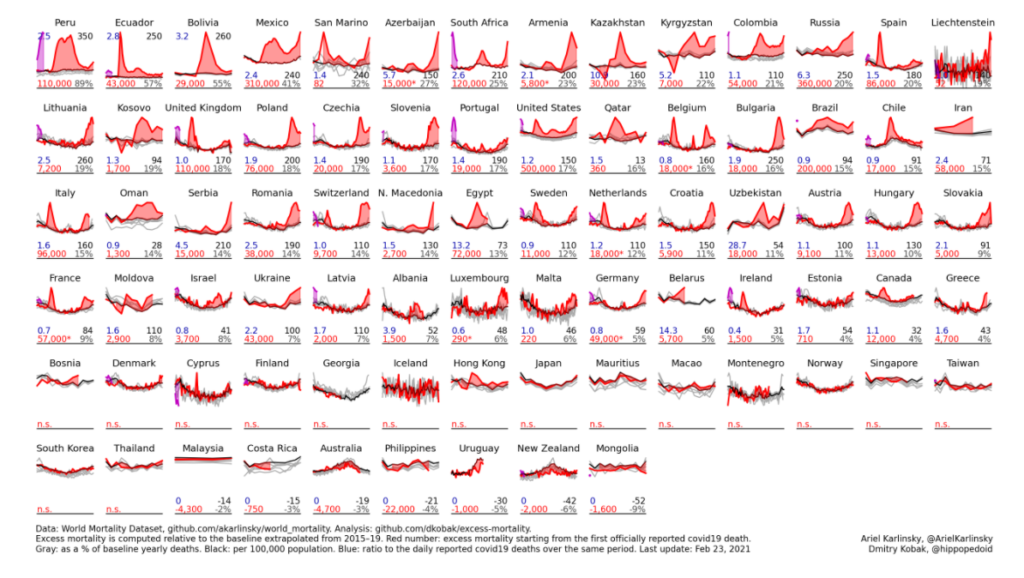
Excerpt:
The data are sourced from the World Mortality Dataset. Excess mortality is computed relative to the baseline obtained using linear extrapolation of the 2015–19 trend. In the figure below, gray lines are 2015–19, black line is baseline for 2020, red line is 2020, purple line is 2021. Countries are sorted by the % increase over the baseline.
Red number: excess mortality starting from the first officially reported Covid-19 death.
Gray number: excess mortality as a % of the annual baseline deaths.
Black number: excess mortality per 100,000 population.
Blue number: ratio to the daily reported Covid-19 deaths over the same period (sourced from JHU).
Author(s): Dmitry Kobak
Date Accessed: 24 February 2021
Publication Site: github
Link: https://polimath.substack.com/p/every-states-covid-numbers-in-context-7e1
Graphic:
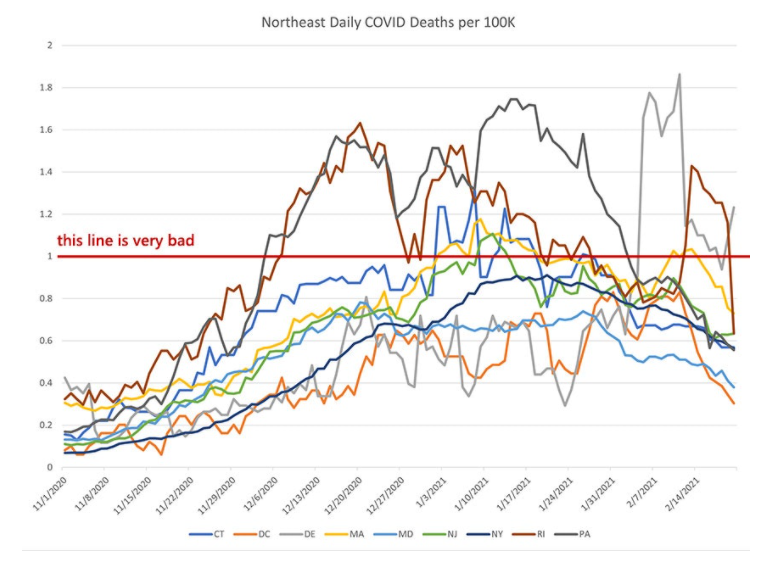
Excerpt:
Comparing the northeast to the mountain states is a near-perfect microcosm of why I tend to think that this pandemic is largely running out on its own schedule with interventions making only a limited impact. We can see the northeast surging shortly after the mountain states and we can see that they are trailing behind on the case reductions.
Even so, we see the same pattern. Cases and deaths are past their peak and are sliding downward. Out hope is that cases can dip below the caution line within the next month or so (though I’m far past making any predictions on this).
Author(s): PoliMath
Publication Date: 23 February 2021
Publication Site: Marginally Compelling at Substack
Graphic:
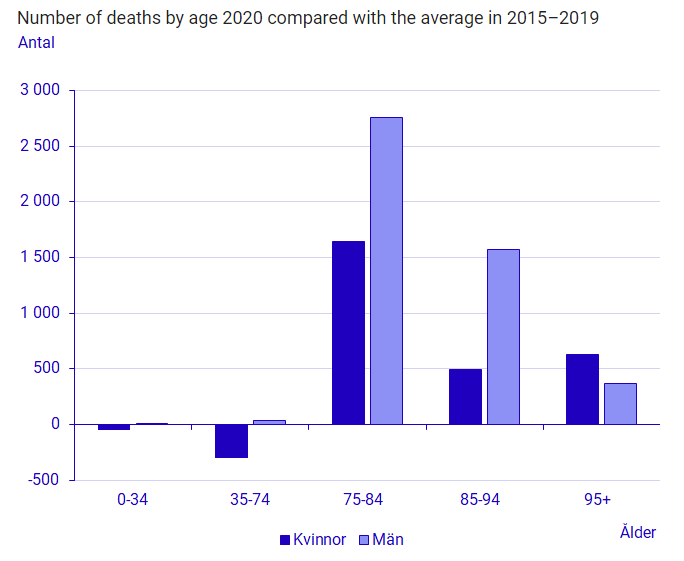
[kvinnor = women, man = men]
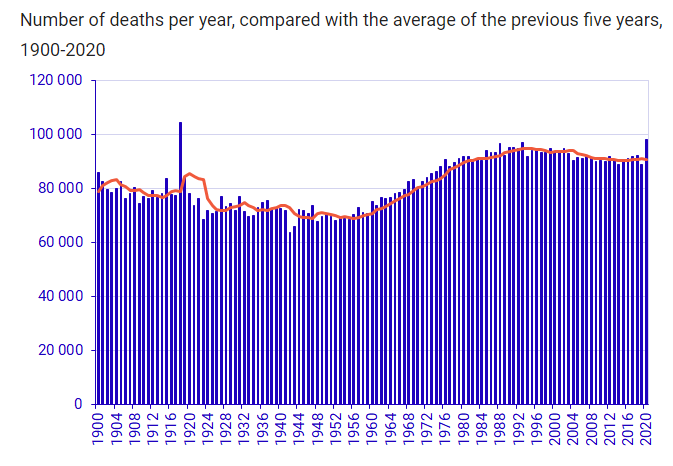
Excerpt: [via Google Translate]
Last year, it was especially in older ages that the number of deaths was more than in the immediately preceding years. The increasing number of deaths also affected men to a greater extent than women. The excess mortality rate last year was greatest among men older than 75 years, in the age group 75–84 years 20.6 per cent died more than during the comparison period. Among younger women 0-34 years, there was no excess mortality, -8.9 percent fewer died compared with the comparison period. For women, just like men, the differences were greatest in the oldest age groups; in the group aged 75–84, 14.7 per cent more deaths were noted than the average over the past five years.
It is not easy to put the number of dead in a longer historical context. Not least because the demographic composition and population of the country has changed. The development of the number of deaths over time is affected partly by the medical development and partly by the development of various diseases and lifestyles. The number of deaths during different periods is also affected by how many are at the ages when most people die.
Publication Date: 22 February 2021
Publication Site: Statistics Sweden
Excerpt:
“The salient policy question isn’t whether the March 25th memo introduced COVID into nursing homes, but whether it contributed to higher infection and mortality rates.
“The department’s comments show that it either doesn’t understand statistics, or is willfully ignoring our findings. Our analysis does, in fact, show a consistent relationship between transfers from hospitals to nursing homes and COVID fatalities. These findings were robust to several statistical assumptions.
“Our report included a statewide statistical analysis, which showed that transfers were associated with deaths at the 99 percent confidence level. Those statewide estimates are the ones we used to estimate that transfers were associated with hundreds of additional deaths. In digging a bit deeper, we hypothesized a differential effect upstate and downstate, which was then corroborated by our analysis.
Author(s): press release
Publication Date: 19 February 2021
Publication Site: Empire Center for Public Policy