Visualizing the American Workforce as 100 People

Link: https://www.visualcapitalist.com/american-workforce-100-people/

Graphic:

Excerpt:

Over the last five years, the American workforce has not stayed static. Of the listed 22 groups, 13 saw growth in employment numbers, nine saw a decrease, and one stayed flat since 2018.

The top gainer by far is Health Support (medical assistants, care aides, orderlies, etc.) which grew by 65%. Looking at the timeline of growth does not paint a steady picture: employment jumped between 2018 and 2019, briefly fell in 2020, and has since risen again in 2021-2022.

Another top gainer is Transport, rising from the 4th to 3rd biggest employer, beating out Sales in 2022. Business & Finance and Management have also seen steady increases since 2018.

On the other hand Hospitality saw a staggering 48% drop in numbers, not all together surprising given the impact of the COVID-19 pandemic as well as the rise of tech companies like Airbnb.

Meanwhile, Office & Admin work saw a 15% loss in employees, even though this category is still the biggest employer in the country by a significant margin. Although jobs in this group saw steady declines from 2018-2021, it registered a slight uptick in workers between 2021 and 2022.

Author(s): Pallavi Rao

Publication Date: 15 May 2023

Publication Site: Visual Capitalist

Employment of “People with a Disability” Spiked to Record in Hot Labor Market. Applications for Disability Benefits Fell to 20-Year Low

Link: https://wolfstreet.com/2023/02/03/employment-of-people-with-a-disability-spiked-to-record-in-hot-labor-market-applications-for-disability-benefits-fell-to-20-year-low/

Graphic:

Excerpt:

The number of people with a disability who were employed in January spiked by 27% from January 2020, to 7.29 million in January — with December at 7.37 million having been the highest in the data from the BLS going back to 2008:

Author(s): Wolf Richter

Publication Date: 3 Feb 2023

Publication Site: Wolf Street

Covid-19 Illnesses Are Keeping at Least 500,000 Workers Out of U.S. Labor Force, Study Says

Link: https://www.wsj.com/articles/covid-19-illnesses-are-keeping-at-least-500-000-workers-out-of-u-s-labor-force-study-says-11662955321

Excerpt:

Illness caused by Covid-19 shrank the U.S. labor force by around 500,000 people, a hit that is likely to persist if the virus continues to sicken workers at current rates, according to a new study released Monday.

Millions of people left the labor force — the number of people working or looking for work — during the pandemic for various reasons, including retirement, lack of child care and fear of Covid. The total size of the labor force reached 164.7 million people in August, exceeding the February 2020 prepandemic level for the first time. The labor force would have 500,000 more members if not for the people sickened by Covid, according to the study’s authors, economists Gopi Shah Goda of Stanford University and Evan J. Soltas at the Massachusetts Institute of Technology.

“If we stay where we are with Covid infection rates going forward, we expect that 500,000-person loss to persist until either exposure goes down or severity goes down,” said Mr. Soltas. That assumes that some of those previously sickened eventually return to work.

Author(s): Gwynn Guilford

Publication Date: 12 Sept 2022

Publication Site: WSJ

How Many People in NYC Are At Risk of Losing Their Job Over the Mayor’s Vaccine Mandate?

Link:https://mishtalk.com/economics/how-many-people-in-nyc-are-at-risk-of-losing-their-job-over-the-mayors-vaccine-mandate

Graphic:

Excerpt:

NYC Vaccination Data shows that at most, 18.3% of New Yorker residents are theoretically impacted, but not all of them work.

….

That is less than half of the population of the city. Factoring in the vaccination rate, about 9% of the entire city is at risk of losing their jobs.

Thus Borelli is wildly off on his percentages.

I am not at all defending mayor de Blasio. Indeed, I heavily blasted him in New York City Mandates Vaccinations, Please Be Ready With Your Vaccine Card.

I am just in search of more accurate numbers.

Author(s): Mike Shedlock

Publication Date: 8 Dec 2021

Publication Site: MishTalk

How the office will be different for workers when they return

Link: https://www.cnbc.com/2021/09/02/how-the-office-will-be-different-for-workers-when-they-return.html

Excerpt:

As companies allow employees to work from home and not commute into an office, the question of where they can live will likely be raised as workers potentially will seek out cheaper options as opposed to big cities.

“It’s good for employees; they’re obviously making a choice and taking advantage of lower cost of living, cheaper housing, lower taxes and shorter commutes, so they’re going to be happier,” Moody’s Analytics chief economist Mark Zandi said.

That, in turn, will make companies address several human resources issues, such as how much they should be paying workers who live in cheaper places, Zandi said.

“For example, say I worked in New York and decided now I want to work in Vero Beach, Florida,” Zandi said. “I don’t want to go back to New York, I can do my job here no problem — but if I’m living in Vero Beach, should I get New York wages or Vero Beach wages?”

Author(s): Ian Thomas

Publication Date: 2 September 2021

Publication Site: CNBC

Impact of COVID-19 on Actuarial Careers: Highlights Report

Link: https://www.soa.org/resources/research-reports/2021/covid-19-highlights/

Report link: https://www.soa.org/globalassets/assets/files/resources/research-report/2021/covid-19-highlights.pdf

Graphic:

Excerpt:

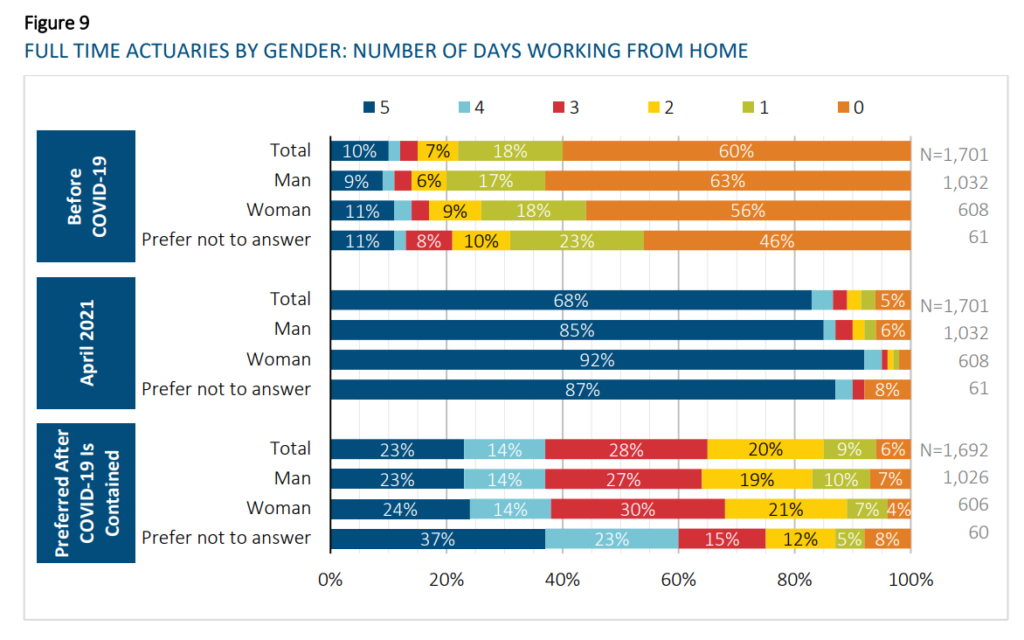
Working from home was a significant change for most actuaries. While some are looking forward to
returning to work in the office, few would like to return to working in the office most or all of the time.
After COVID-19 restrictions are fully lifted, approximately 65% of full-time respondents would prefer to
work from home at least 3 days per week: 28% would prefer to work from home three days per week, 23%
would like to work from home every day, and 14% would prefer to work from home 4 days per week.

In general, respondents who identify as women have a slight preference to work from home more
frequently than do respondents who identify as men.

Author(s): SOA

Publication Date: June 2021

Publication Site: Society of Actuaries