Provisional Drug Overdose Death Counts

Link: https://www.cdc.gov/nchs/nvss/vsrr/drug-overdose-data.htm

Graphic:
Excerpt:

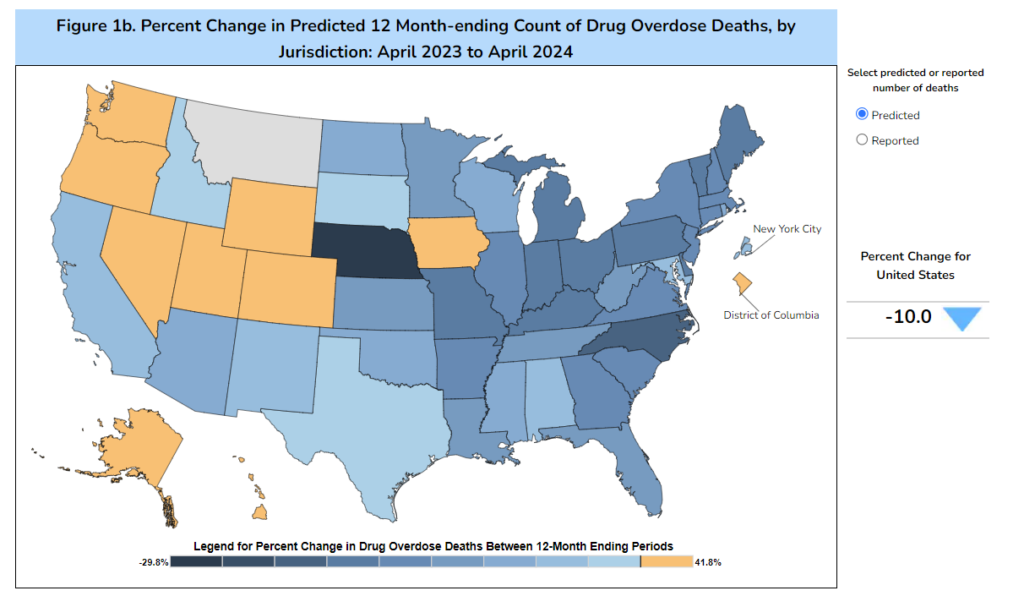
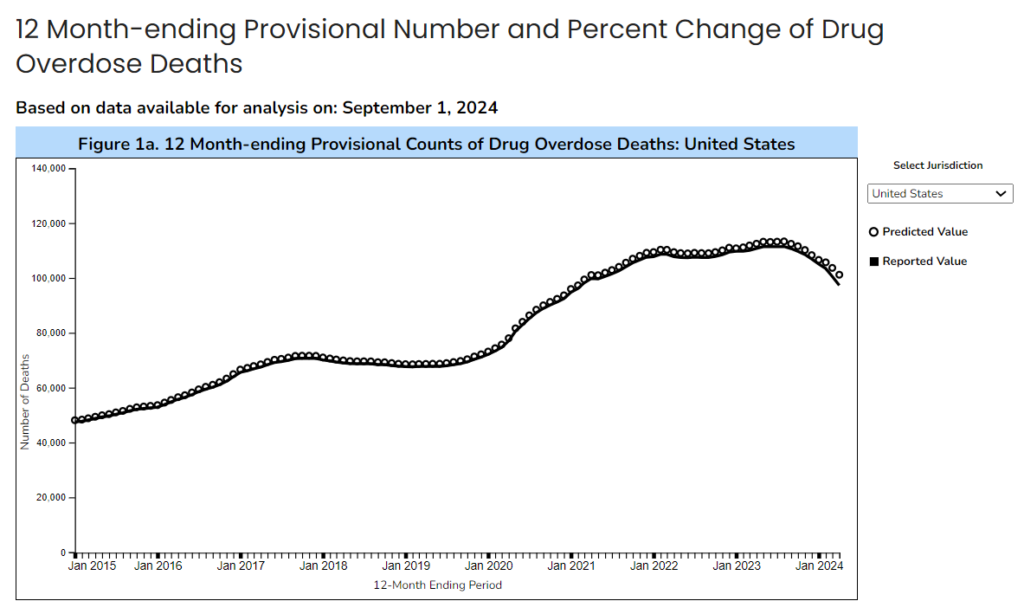
This data visualization presents provisional counts for drug overdose deaths based on a current flow of mortality data in the National Vital Statistics System. Counts for the most recent final annual data are provided for comparison. National provisional counts include deaths occurring within the 50 states and the District of Columbia as of the date specified and may not include all deaths that occurred during a given time period. Provisional counts are often incomplete and causes of death may be pending investigation (see Technical notes) resulting in an underestimate relative to final counts. To address this, methods were developed to adjust provisional counts for reporting delays by generating a set of predicted provisional counts (see Technical notes).

The provisional data presented in this visualization include: (a) the reported and predicted provisional counts of deaths due to drug overdose occurring nationally and in each jurisdiction; (b) a U.S. map of the percentage changes in provisional drug overdose deaths for the current 12 month-ending period compared with the 12-month period ending in the same month of the previous year, by jurisdiction; and (c) the reported and predicted provisional counts of drug overdose deaths involving specific drugs or drug classes occurring nationally and in selected jurisdictions. The reported and predicted provisional counts represent the numbers of deaths due to drug overdose occurring in the 12-month periods ending in the month indicated. These counts include all seasons of the year and are insensitive to variations by seasonality. Deaths are reported by the jurisdiction in which the death occurred.

Several data quality metrics, including the percent completeness in overall death reporting, percentage of deaths with cause of death pending further investigation, and the percentage of drug overdose deaths with specific drugs or drug classes reported are included to aid in interpretation of provisional data as these measures are related to the accuracy of provisional counts (see Technical notes). Reporting of the specific drugs and drug classes involved in drug overdose deaths varies by jurisdiction, and comparisons of death rates involving specific drugs across selected jurisdictions should not be made (see Technical notes). Provisional data presented in this visualization will be updated on a monthly basis as additional records are received.

Publication Date: Accessed 19 Sept 2024

Publication Site: National Center for Health Statistics, CDC

Drug Overdose Mortality by Usual Occupation and Industry: 46 U.S. States and New York City, 2020

Link: https://www.cdc.gov/nchs/data/nvsr/nvsr72/nvsr72-07.pdf

Graphic:

Excerpt:

Objective—This report describes deaths from drug overdoses in 2020 in U.S. residents in 46 states and New York City by usual occupation and industry. August 22, 2023

Conclusions—Variation in drug overdose death rates and PMRs by usual occupation and industry in 2020 demonstrates the disproportionate burden of the ongoing drug overdose crisis on certain sectors of the U.S. workforce.

Methods—Frequencies, death rates, and proportionate mortality ratios (PMRs) are presented using the 2020 National Vital Statistics System mortality data file. Data were restricted to decedents aged 16–64 for rates and 15–64 for PMRs with usual occupations and industries in the paid civilian workforce. Age-standardized drug overdose death rates were estimated for usual occupation and industry groups overall, and age-adjusted drug overdose PMRs were estimated for each usual occupation and industry group overall and by sex, race and Hispanic-origin group, type of drug, and drug overdose intent. Age-adjusted drug overdose PMRs were also estimated for individual occupations and industries.

Results—Drug overdose mortality varied by usual occupation and industry. Workers in the construction and extraction occupation group (162.6 deaths per 100,000 workers, 95% confidence interval: 155.8–169.4) and construction industry group (130.9, 126.0–135.8) had the highest drug overdose death rates. The highest group-level drug overdose PMRs were observed in decedents in the construction and extraction occupation group and the construction industry group (145.4, 143.6–147.1 and 144.9, 143.2–146.5, respectively). Differences in drug overdose PMRs by usual occupation and industry group were observed within each sex, within each race and Hispanicorigin group, by drug type, and by drug overdose intent. Among individual occupations and industries, the highest drug overdose PMRs were observed in decedents who worked as fishers and related fishing occupations and in fishing, hunting, and trapping industries (193.1, 166.8–222.4 and 186.5, 161.7–214.1, respectively).

Author(s): Billock RM, Steege AL, Miniño A.

Publication Date: August 22, 2023

Publication Site: CDC, National Vital Statistics System

The Shady Statistics Behind the War on Painkillers

Link: https://reason.com/video/2023/10/11/the-shady-statistics-behind-the-war-on-painkillers/

Graphic:

Excerpt:

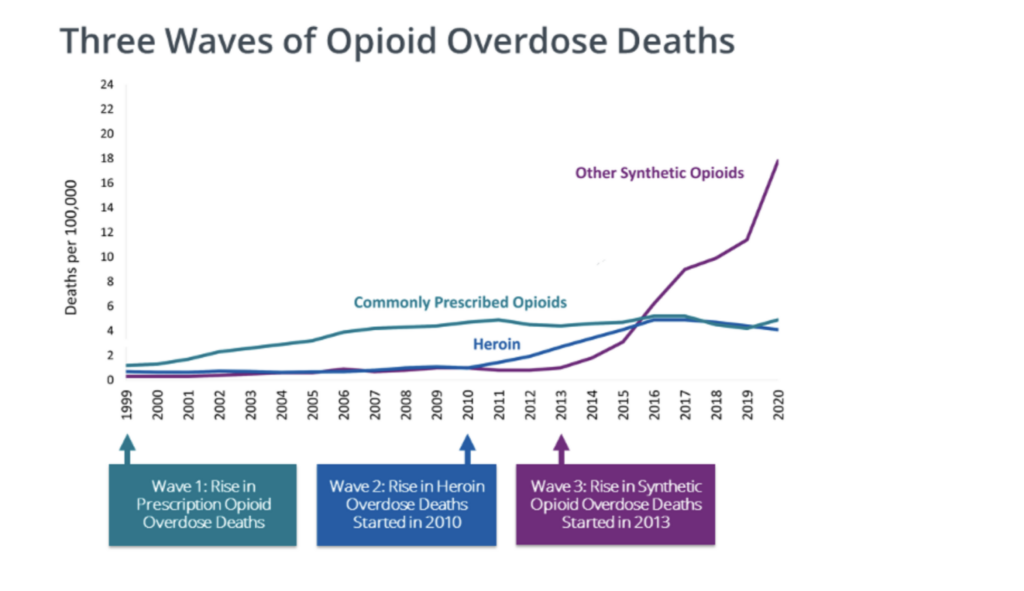
The attack on opioid prescriptions for non-cancer chronic pain began to advance around 2010, and intensified thereafter. The crackdown coincided with—and perhaps caused—a rapid growth in heroin overdose deaths, and later, an explosion in illegal synthetic opioid deaths, primarily fentanyl, an illicitly manufactured substance added to or substituted for heroin to meet the increasing demand for illegal opiates. This pattern of events is illustrated in a graphic put out by the Centers for Disease Control (CDC).

Indeed, overdose deaths from commonly prescribed opiates increased rapidly from 1999 to 2010, but the chart doesn’t tell us how many of the victims legally obtained the opiates. The chosen scale also omits the fact that drug overdose deaths have been increasing at a fairly steady rate since 1979, with no obvious changes associated with the rise and fall of opioid prescriptions for chronic pain. The chart does show how overdose death rates from commonly prescribed opiates did not decline much after 2010, although legal prescriptions went down dramatically. This suggests that these deaths may have involved individuals who bought illegally manufactured opiates, or that the people who lost pain medication as a result of official actions were not the ones liable to overdose.

The increase in deaths of despair obviously merits some policy attention, but labeling it an “opioid crisis,” as is common nowadays, profoundly misstates its nature, timing, and likely causes and solutions. To justify restricting opioids for non-cancer chronic pain patients requires specific evidence that people prescribed opioids for pain are the ones dying of overdoses. There’s quite a bit of negative evidence on this score, but public health officials have seized on a few positive studies to support their claims.

One influential and heavily cited 2011 study published in the Journal of the American Medical Association, “Association Between Opioid Prescribing Patterns and Opioid Overdose-Related Deaths,” uses a classic prohibitionist tactic. The authors use a sample of 750 Veterans Health Administration (VHA) patients who received opioid prescriptions for pain and later died of opioid overdoses, and compare them to a random sample of 155,000 other VHA patients who received opioid prescriptions and did not die of overdoses.

Author(s): Aaron Brown

Publication Date: 11 Oct 2023

Publication Site: Reason

Overdoses soared even as prescription pain pills plunged/Highest death rates hit counties where doses of pain pills per person had been top in nation

Link: https://www.washingtonpost.com/investigations/2023/09/12/us-overdose-deaths-opioid-crisis/

Excerpt:

The number of prescription opioid pain pills shipped in the United States plummeted nearly 45 percent between 2011 and 2019, new federal data shows, even as fatal overdoses rose to record levels as users increasingly used heroin, and then illegal fentanyl.

The data confirms what’s long been known about the arc of the nation’s addiction crisis: Users first got hooked by pain pills saturating the nation, then turned to cheaper and more readily available street drugs after law enforcement crackdowns, public outcry and changes in how the medical community views prescribing opioids to treat pain.

The drug industry transaction data, collected by the Drug Enforcement Administration and released Tuesday by attorneys involved in the massive litigation against opioid industry players, reveals that the number of prescription hydrocodone and oxycodone pills peaked in 2011 at 12.8 billion pills, and dropped to fewer than 7.1 billion by 2019. Shipments of potent 80-milligram oxycodone pills dropped 92 percent in 2019 from their peak a decade earlier.

Many of the counties with the highest fentanyl death rates — in hard-hit states such as West Virginia, Kentucky and Ohio — started out with alarmingly high doses of prescription pills per capita, according to a Washington Post analysis of the DEA data and federal death records.

Counties with the highest average doses of legal pain pills per person from 2006 to 2013 suffered the highest death rates in the nation over the subsequent six years.

….

Annual overall overdose deaths reached a grim milestone in 2021, surpassing 100,000 for the first time in U.S. history. More than 110,000 people died of drug overdoses in 2022, two-thirds of whom succumbed to synthetic opioids such as fentanyl, according to estimates by the Centers for Disease Control and Prevention.

Author(s): Rich, Steven; Ovalle, David

Publication Date: 12 Sep 2023

Publication Site: Washington Post

$50 Billion in Opioid Settlement Cash Is on the Way. We’re Tracking How It’s Spent.

Link: https://kffhealthnews.org/news/article/opioid-drugmakers-settlement-funds-50-billion-dollars-khn-investigation-payback/

Graphic:

Excerpt:

More than $50 billion in settlement funds is being delivered to thousands of state and local governments from companies accused of flooding their communities with opioid painkillers that have left millions addicted or dead.

….

Most of the settlements stipulate that states must spend at least 85% of the money they will receive over the next 15 years on addiction treatment and prevention. But defining those concepts depends on stakeholders’ views — and state politics. To some, it might mean opening more treatment sites. To others, buying police cruisers.

….

What’s more, many states are not being transparent about where the funds are going and who will benefit. An investigation by KHN and Christine Minhee, founder of OpioidSettlementTracker.com, concluded only 12 states have committed to detailed public reporting of all their spending.

The analysis involved scouring hundreds of legal documents, laws, and public statements to determine how each state is divvying up its settlement money among state agencies, city and county governments, and councils that oversee dedicated trusts. The next step was to determine the level and detail of public reporting required. The finding: Few states promise to report in ways that are accessible to the average person, and many are silent on the issue of transparency altogether.

More than $3 billion has gone out to state and local governments so far. KHN will be following how that cash — and the billions set to arrive in coming years — is used.

Author(s): Aneri Pattani

Publication Date: 30 March 2023

Publication Site: Kaiser Health News

Flesh-rotting drug ‘Tranq’ linked to dozens of NY deaths: Schumer

Link: https://nypost.com/2023/03/26/new-york-seeing-tranq-drug-related-deaths-schumer/

Graphic:

Excerpt:

Tranq – the deadly “zombie” drug formally known as xylazine – is circulating across New York and has been tied to dozens of deaths in the state, Senate Majority Leader Chuck Schumer warned Sunday.

Use of the flesh-rotting substance is “spreading” in Syracuse, Albany, Rochester and the Greater New York City area, Schumer said, as he called on increased federal funding for the state to help fight the disturbing trend.

….

Tranq, a veterinary drug, is Narcan-resistant, meaning its effects cannot be reversed in the event of an overdose.

It is said to cause skin and bone to deteriorate or rot over time. 

The US Drug Enforcement Administration recently issued a public safety alert, announcing that the agency had seized mixtures of xylazine and fentanyl in 48 of the 50 states. 

Author(s):Haley Brown and Stephanie Pagones

Publication Date: 26 Mar 2023

Publication Site: NY Post

Movember 2022: Men and Drug Overdoses (and Giving Tuesday!)

Link: https://marypatcampbell.substack.com/p/movember-2022-men-and-drug-overdoses

Graphic:

Excerpt:

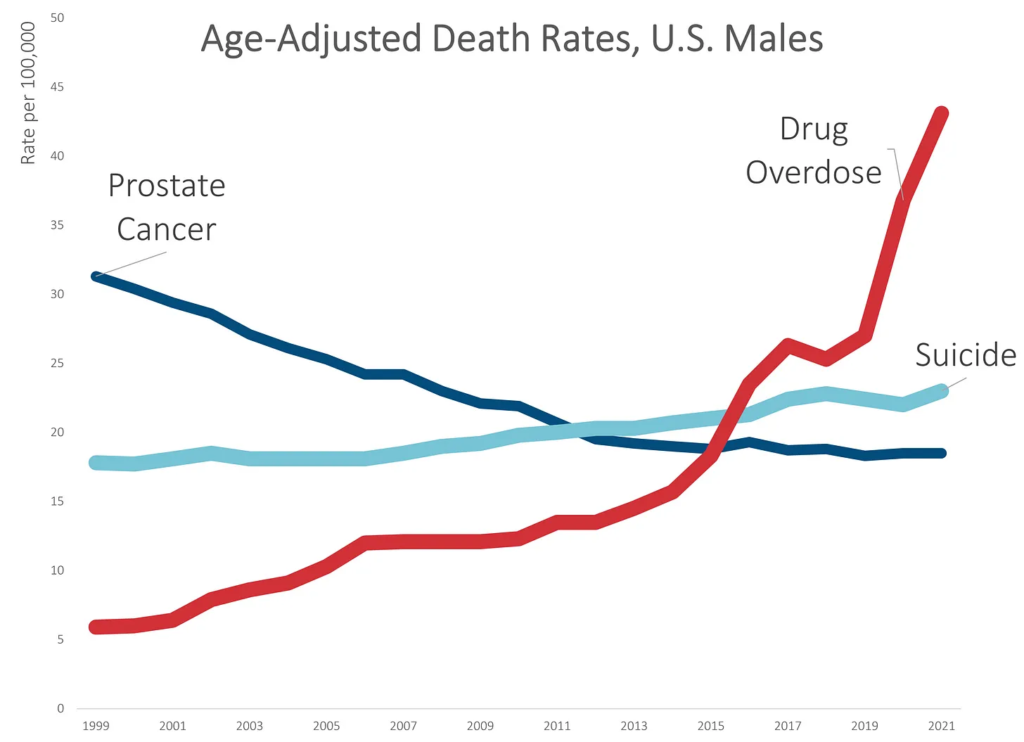
Remember the graph I made showing the suicide trend for men crossing over from prostate cancer?

Let me layer on unintentional drug overdoses:

Yeah, it’s as bad as it looks.

While death rates due to suicide increased by about 30% over the 20-year period, death rates due to unintentional drug overdoses increased by over 500%.

None of this is really a surprise. I’ve written about the drug OD problem many times before, which had a horrible trend before the pandemic and got much, much worse during the pandemic.

Much of the increase came in 2020 and 2021 — over 30% in 2020, and 17% in 2021. These are huge increases on rates that were already bad.

Author(s): Mary Pat Campbell

Publication Date: 29 Nov 2022

Publication Site: STUMP at substack

Millennial Massacre Part 2: Increase In Mortality for Ages 18-39 for 2020-2021 Mainly Driven by Drug Overdoses and COVID

Link: https://marypatcampbell.substack.com/p/millennial-massacre-part-2-increase

Graphic:

Excerpt:

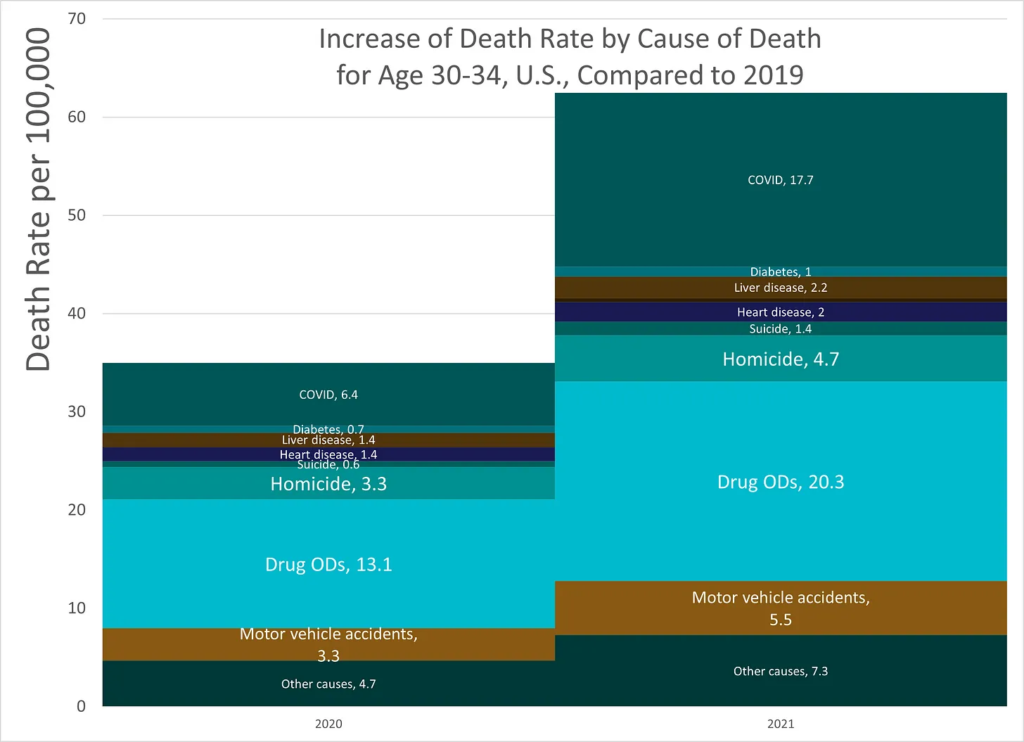
  • About 30% of the contribution to excess mortality for young adults in 2021 came from drug overdoses.
  • The percentage contribution to excess mortality of drug ODs was not that different by age group over the 18-39 age span.
  • COVID as a contribution to excess mortality was higher for older people —- for those age 35-39, 36% of their excess mortality came from COVID in 2021. In contrast, for those age 18-24, only 17% of their excess mortality came from COVID.
  • Indeed, the youngest of the adults (age 18-24) had higher contributions from homicide (20% of excess mortality) and had comparable excess mortality contribution from motor vehicle accidents (16%) in 2021.

Author(s): Mary Pat Campbell

Publication Date: 23 Jul 2022

Publication Site: STUMP at substack

Fentanyl Overdose Rates Are Rising Fast

Link: https://www.wsj.com/articles/overdose-rates-are-rising-fast-cdc-drugs-opiod-crisis-substance-abuse-addiction-fatal-syringe-11652904604

Excerpt:

The latest tally of fatal drug overdoses from the Centers for Disease Control and Prevention shows nearly 108,000 fatalities in 2021. This is far more than in 2017, when President Trump declared drug deaths a public-health emergency. Among blacks, the drug mortality rate has quadrupled in less than eight years.

The Trump administration acted aggressively and directed agencies to implement several recommendations from the Commission on Combatting Drug Addiction and the Opioid Crisis. These included changes to prescribing patterns, treatment paradigms and law-enforcement procedures. The rate of deaths from drug overdoses slowed and then dipped. But then Covid hit, with all its mental-health consequences. The addiction and overdose crisis is now the most important public-health issue facing the country.

…..

Coincident with policy changes advertised as civil-rights progress, the comparatively low drug-overdose rate for blacks began to accelerate. It reached the white rate by 2019 and then surged past it during the pandemic to reach 43 annually per 100,000 of the black population by last September.

Rather than gawking at an accelerating overdose crisis, policy makers could benefit people of all races by investigating new sources of demand and supply. Instead, in a world where a single backpack of fentanyl could kill a million people, Mr. Biden eliminates the controls on illegal immigration instituted by his predecessor.

Author(s): Joseph Grogan and Casey B. Mulligan

Publication Date: 18 May 2022

Publication Site: WSJ

Childhood Mortality Trends, 1999-2021 (provisional), Ages 1-17

Link: https://marypatcampbell.substack.com/p/childhood-mortality-trends-1999-2021

Graphic:

Excerpt:

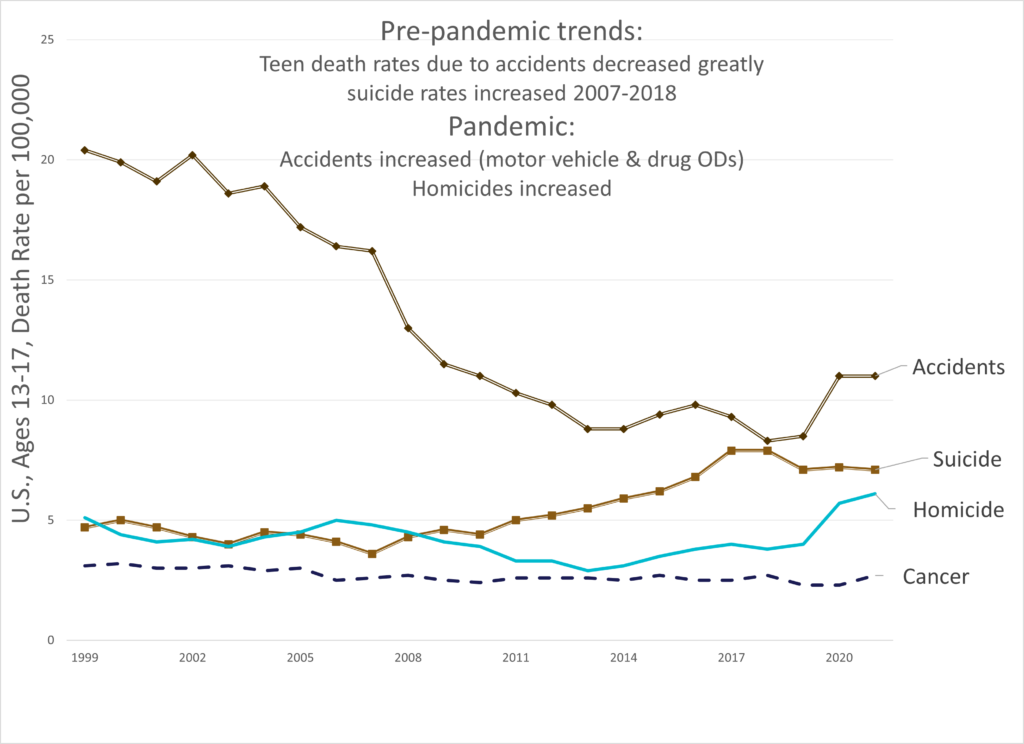
There was the good news from before the pandemic: the accidental death rate had come way, way down. That was mostly due to improved traffic safety. (Not reduced drug ODs, alas)

In the pandemic, both increased motor vehicle deaths and drug overdoses has pushed up the accidental death rate for teens to increase to levels seen a decade ago.

But there was a bad pre-pandemic trend: suicide rates had increased from 2007 to 2018 — increasing a total of 120% over that period. That was hideous.

It seemed to have reversed in 2019, and come down during the pandemic. The suicide trends in the pandemic really made no sense to anybody, but perhaps the increased drug ODs were actually suicides.

Homicides didn’t have a steady trend before the pandemic, but has definitely had a bad trend during the pandemic. Homicide death rates for teens increased over 50% from 2019 to 2021.

One observation: suicide and homicide death rates used to be about the same for teens in the early 2000s, and then with the bad suicide trend, suicide ranked higher. Even with the increase in homicide rates, suicide still ranks higher.

Author(s): Mary Pat Campbell

Publication Date: 15 June 2022

Publication Site: STUMP at substack

Drug-Overdose Deaths Reached a Record in 2021, Fueled by Fentanyl

Link: https://www.wsj.com/articles/drug-overdose-deaths-reached-a-record-in-2021-fueled-by-fentanyl-11652277600

Graphic:

Excerpt:

Drug-overdose deaths in 2021 topped 100,000 for the first time in a calendar year, federal data showed, a record high fueled by the spread of illicit forms of fentanyl throughout the country.

More than 107,000 people in the U.S. died from drug overdoses last year, preliminary Centers for Disease Control and Prevention data released Wednesday showed, roughly a 15% increase from 2020. The proliferation of the potent synthetic opioid fentanyl has been compounded by the destabilizing effects of the Covid-19 pandemic on users and people in recovery, according to health authorities and treatment providers.

The U.S. has recorded more than one million overdose deaths since 2000, and more than half of those came in the past seven years.

….

The agency has counted about 103,600 overdoses for 2021 but believes the number is several thousand higher due to suspected overdoses that haven’t yet been confirmed by local death investigators, Dr. Anderson said.

Author(s): Jon Kamp

Publication Date: 11 May 2022

Publication Site: WSJ

U.S. Mortality Trends Through the Pandemic

Link: https://marypatcampbell.substack.com/p/us-mortality-trends-through-the-pandemic?s=w

Video:

Graphic:

Excerpt:

I discuss this in the portion of the talk about death rates by age group.

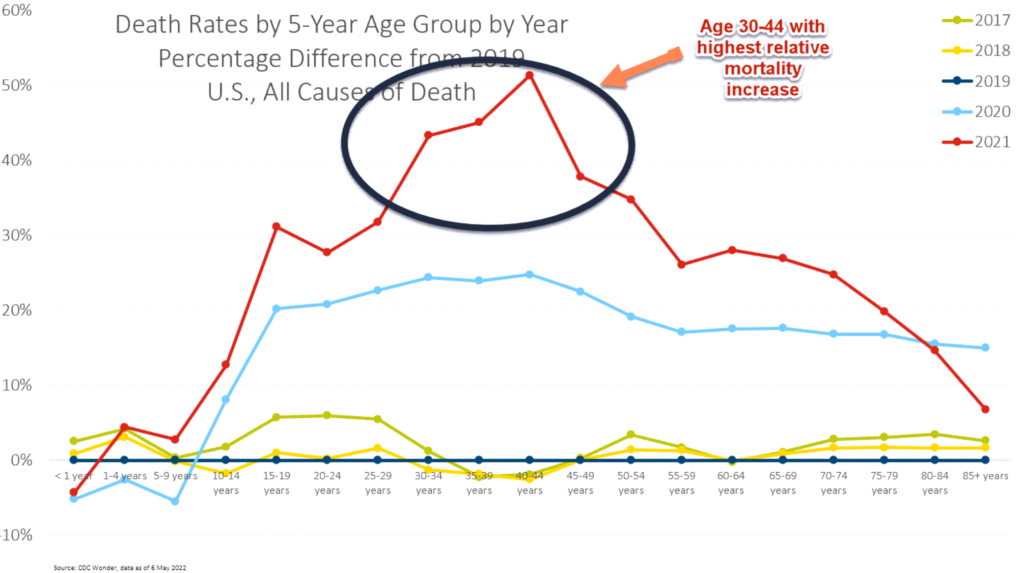
For 2021, the worst relative increase in mortality, compared to 2019, was for ages 30-44.

[I have called it the Millennial Massacre, but it obviously overlaps with Gen X…. and Middle Age Massacre doesn’t exactly work, either. Dang the allure of alliteration].

We will see in a moment that most of that mortality increase didn’t come from COVID.

If you look at overall mortality, obviously total mortality for this age group is much lower than for those much older.

A 5% increase in mortality for those aged 85+ will translate to a much larger number of deaths, but a 50% increase in mortality for those aged 40-44 is extremely worrisome to actuaries and insurers even if the absolute number of deaths is lower in impact. We’re setting reserves and expectations based on certain assumptions, and we’re generally not assuming fluctuations of 50% — that’s just nuts compared to our historical experience…..

…..until now.

Author(s): Mary Pat Campbell

Publication Date: 20 May 2022

Publication Site: STUMP on substack