Visualizing the Growth in Working Age Populations Over 10 Years

Link: https://www.visualcapitalist.com/growth-in-working-age-populations-over-10-years/

Graphic:
Excerpt:

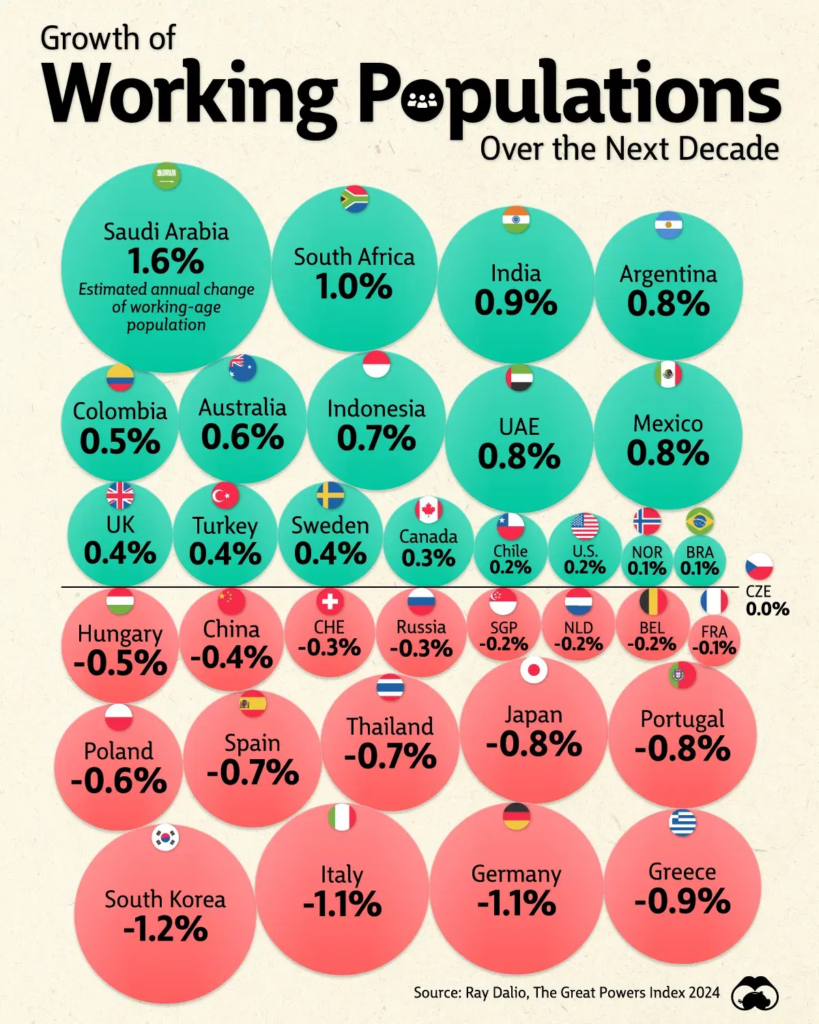
Today, the working age population in almost half of U.S. metropolitan areas has declined due to demographic shifts, and this trend is set to continue.

As a result, the U.S. workforce is projected to grow at just 0.2% annually over the next decade, roughly a quarter of the rate of markets like India and Mexico. Given the low birth rates and aging populations across many advanced economies, the world’s workforce is set to change significantly, with implications for economic and productivity growth.

This graphic shows the projected growth in major economies’ working age population, based on analysis from Ray Dalio’s Great Powers Index 2024.

Author(s): Dorothy Neufeld

Publication Date: 23 Sept 2024

Publication Site: Visual Capitalist
Ranked: The U.S. Banks With the Most Uninsured Deposits

Link: https://elements.visualcapitalist.com/ranked-the-u-s-banks-with-the-most-uninsured-deposits/

Graphic:

Excerpt:

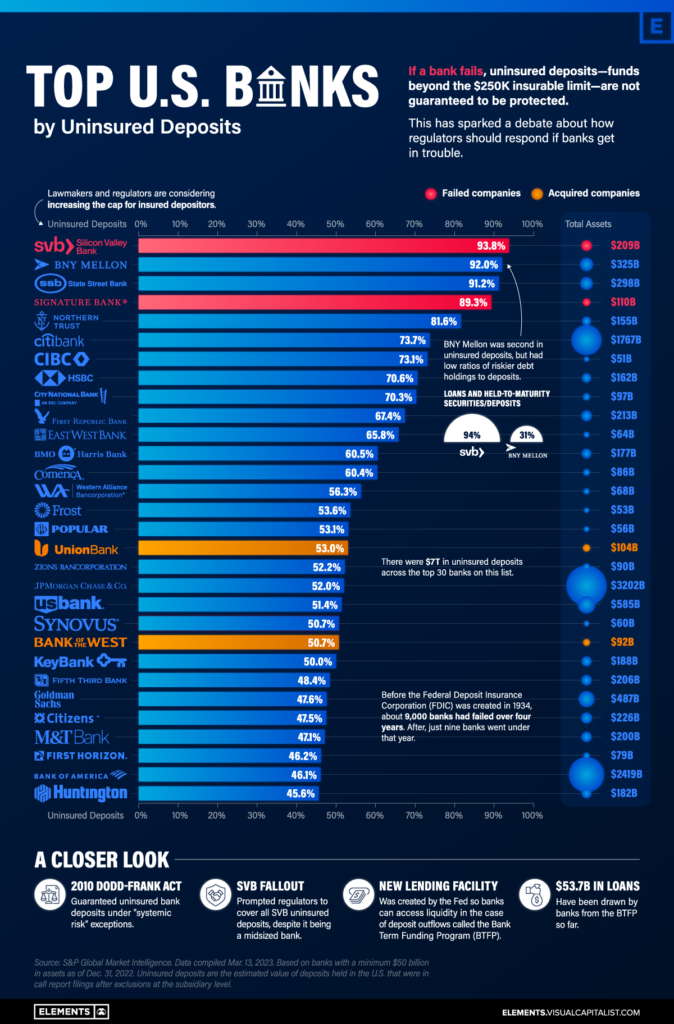
Today, there is at least $7 trillion in uninsured bank deposits in America.

This dollar value is roughly three times that of Apple’s market capitalization, or about equal to 30% of U.S. GDP. Uninsured deposits are ones that exceed the $250,000 limit insured by the Federal Deposit Insurance Corporation (FDIC), which was actually increased from $100,000 after the Global Financial Crisis. They account for roughly 40% of all bank deposits.

In the wake of the Silicon Valley Bank (SVB) fallout, we look at the 30 U.S. banks with the highest percentage of uninsured deposits, using data from S&P Global.

Author(s): Dorothy Neufeld, Sabrina Lam

Publication Date: 4 April 2023

Publication Site: Visual Capitalist
Mapped: The Top U.S. Exports by State

Link: https://www.visualcapitalist.com/cp/mapped-the-top-us-exports-by-state/

Graphic:

Excerpt:

The U.S. exported over $1.3 trillion in goods in 2020, the second-highest amount worldwide.

While refined petroleum was the top export overall at $58.4 billion, aircraft exports were actually the highest across 14 states—more than any other form of export.

This infographic from OnDeck shows America’s top exports by state, using January 2022 data from the U.S. Census Bureau.

Author(s): NeoMam Studios, Dorothy Neufeld

Publication Date: 19 Jul 2022

Publication Site: Visual Capitalist
Visualizing the Three Different Types of Inflation

Link: https://advisor.visualcapitalist.com/three-different-types-of-inflation/

Graphic:

Excerpt:

Monetary inflation occurs when the U.S. money supply increases over time. This represents both physical and digital money circulating in the economy including cash, checking accounts, and money market mutual funds.

The U.S. central bank typically influences the money supply by printing money, buying bonds, or changing bank reserve requirements. The central bank controls the money supply in order to boost the economy or tame inflation and keep prices stable.

Between 2020-2021, the money supply increased roughly 25%—a historic record—in response to the COVID-19 crisis. Since then, the Federal Reserve began tapering its bond purchases as the economy showed signs of strength.

Author(s): Dorothy Neufeld

Publication Date: 16 Jun 2022

Publication Site: Visual Capitalist

Visualizing the 700-Year Fall of Interest Rates

Link: https://www.visualcapitalist.com/700-year-decline-of-interest-rates/

Graphic:

Excerpt:

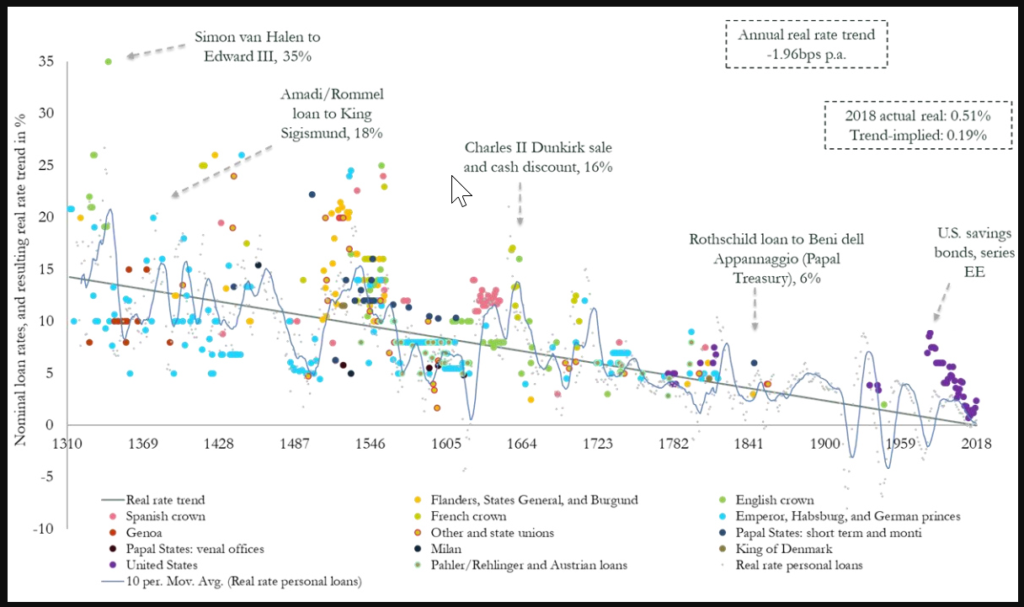
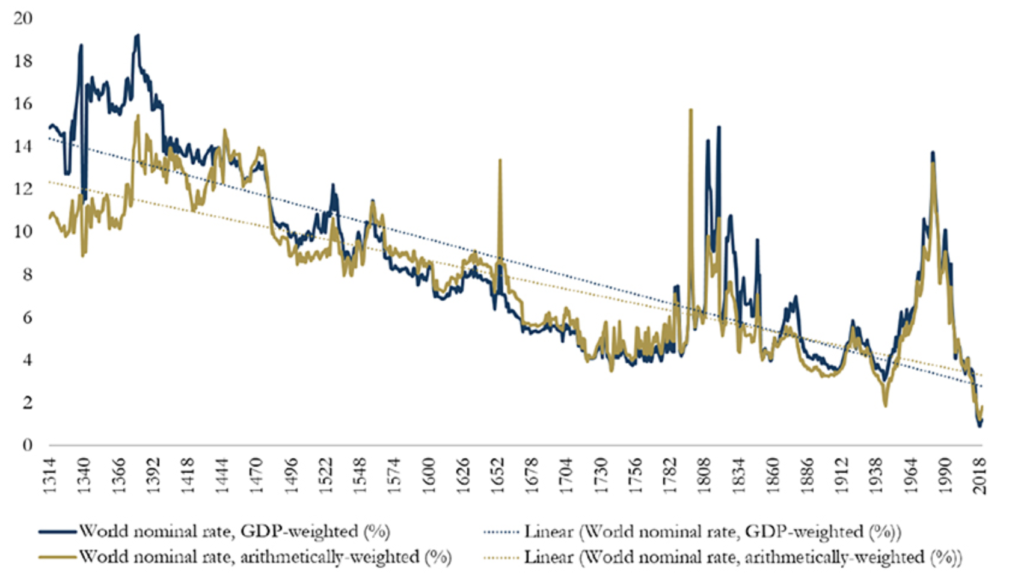
Today’s graphic from Paul Schmelzing, visiting scholar at the Bank of England (BOE), shows how global real interest rates have experienced an average annual decline of -0.0196% (-1.96 basis points) throughout the past eight centuries.

The Evidence on Falling Rates

Collecting data from across 78% of total advanced economy GDP over the time frame, Schmelzing shows that real rates* have witnessed a negative historical slope spanning back to the 1300s.

Displayed across the graph is a series of personal nominal loans made to sovereign establishments, along with their nominal loan rates. Some from the 14th century, for example, had nominal rates of 35%. By contrast, key nominal loan rates had fallen to 6% by the mid 1800s.

Author(s): Dorothy Neufeld

Publication Date: 4 Feb 2020

Publication Site: Visual Capitalist

Visualizing the 700-Year Fall of Interest Rates

Link:https://www.visualcapitalist.com/700-year-decline-of-interest-rates/

Graphic:

Excerpt:

Today’s graphic from Paul Schmelzing, visiting scholar at the Bank of England (BOE), shows how global real interest rates have experienced an average annual decline of -0.0196% (-1.96 basis points) throughout the past eight centuries.

….

Starting in 1311, data from the report shows how average real rates moved from 5.1% in the 1300s down to an average of 2% in the 1900s.

The average real rate between 2000-2018 stands at 1.3%.

….

Demographics impact interest rates on a number of levels. The aging population—paired with declining fertility levels—result in higher savings rates, longer life expectancies, and lower labor force participation rates.

In the U.S., baby boomers are retiring at a pace of 10,000 people per day, and other advanced economies are also seeing comparable growth in retirees. Theory suggests that this creates downward pressure on real interest rates, as the number of people in the workforce declines.

Author(s): Dorothy Neufeld

Publication Date: 4 Feb 2020

Publication Site: Visual Capitalist