Vehicle Crashes, Surging

Link: https://www.nytimes.com/2022/02/15/briefing/vehicle-crashes-deaths-pandemic.html

Graphic:
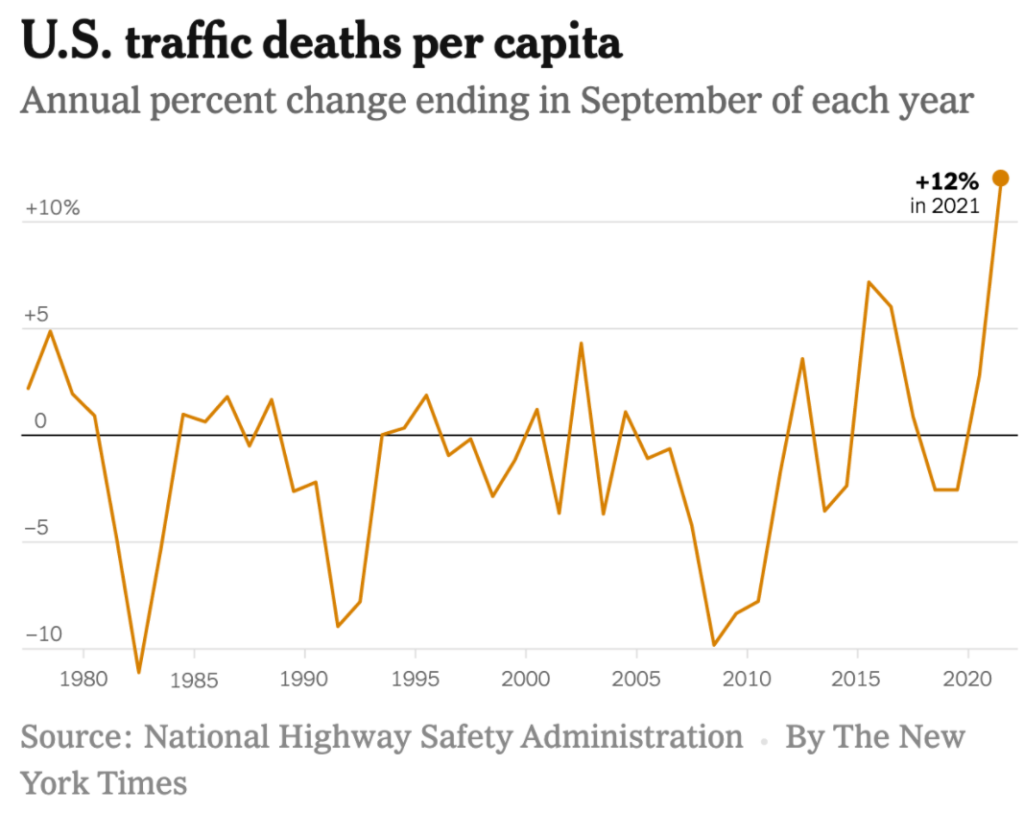
Excerpt:

Per capita vehicle deaths rose 17.5 percent from the summer of 2019 to last summer, according to a Times analysis of federal data. It is the largest two-year increase since just after World War II.

….

Rising drug abuse during the pandemic seems to play an important role, as well. The U.S. Department of Transportation has reported that “the proportion of drivers testing positive for opioids nearly doubled after mid-March 2020, compared to the previous 6 months, while marijuana prevalence increased by about 50 percent.” (Mid-March 2020 is when major Covid mitigations began.)

….

Vehicle crashes might seem like an equal-opportunity public health problem, spanning racial and economic groups. Americans use the same highways, after all, and everybody is vulnerable to serious accidents. But they are not equally vulnerable.

Traffic fatalities are much more common in low-income neighborhoods and among Native and Black Americans, government data shows. Fatalities are less common among Asian Americans. (The evidence about Latinos is mixed.) There are multiple reasons, including socioeconomic differences in vehicle quality, road conditions, substance abuse and availability of crosswalks.

Author(s): David Leonhardt

Publication Date: 15 Feb 2022

Publication Site: NYT

Trying to Make Sense of COVID’s Mysterious 2-Month Cycle

Link:https://news.yahoo.com/trying-sense-covids-mysterious-2-121821028.html

Excerpt:

The number of new daily cases in the United States has fallen 35% since Sept. 1. Worldwide, cases have also dropped more than 30% since late August. “This is as good as the world has looked in many months,” Dr. Eric Topol of Scripps Research wrote last week.

The most encouraging news is that the most serious forms of COVID are also declining. The number of Americans hospitalized with COVID has fallen about 25% since Sept. 1. Daily deaths — which typically change direction a few weeks after cases and hospitalizations — have fallen 10% since Sept. 20. It is the first sustained decline in deaths since early summer.

These declines are consistent with a pattern that readers will recognize: COVID’s mysterious two-month cycle. Since the COVID virus began spreading in late 2019, cases have often surged for about two months — sometimes because of a variant, such as delta — and then declined for about two months.

Public health researchers do not understand why. Many popular explanations — such as seasonality or the ebbs and flows of mask wearing and social distancing — are clearly insufficient, if not wrong. The two-month cycle has occurred during different seasons of the year and occurred even when human behavior was not changing in obvious ways.

Author(s): David Leonhardt

Publication Date: 4 Oct 2021

Publication Site: Yahoo News (originally at NYT)

Data Shows Less Alarming Picture of Delta

Link: https://www.nytimes.com/2021/09/07/briefing/risk-breakthrough-infections-delta.html

Excerpt:

How small are the chances of the average vaccinated American contracting Covid? Probably about one in 5,000 per day, and even lower for people who take precautions or live in a highly vaccinated community.

Or maybe one in 10,000

The estimates here are based on statistics from three places that have reported detailed data on Covid infections by vaccination status: Utah; Virginia; and King County, which includes Seattle, in Washington state. All three are consistent with the idea that about one in 5,000 vaccinated Americans have tested positive for Covid each day in recent weeks.

The chances are surely higher in the places with the worst Covid outbreaks, like the Southeast. And in places with many fewer cases — like the Northeast, as well as the Chicago, Los Angeles and San Francisco areas — the chances are lower, probably less than 1 in 10,000. That’s what the Seattle data shows, for example. (These numbers don’t include undiagnosed cases, which are often so mild that people do not notice them and do not pass the virus to anyone else.)

Here’s one way to think about a one-in-10,000 daily chance: It would take more than three months for the combined risk to reach just 1 percent.

Author(s): David Leonhardt

Publication Date: 7 September 2021

Publication Site: NY Times

A Misleading C.D.C. Number

Link: https://www.nytimes.com/2021/05/11/briefing/outdoor-covid-transmission-cdc-number.html

Excerpt:

When the Centers for Disease Control and Prevention released new guidelines last month for mask wearing, it announced that “less than 10 percent” of Covid-19 transmission was occurring outdoors. Media organizations repeated the statistic, and it quickly became a standard description of the frequency of outdoor transmission.

….

That benchmark “seems to be a huge exaggeration,” as Dr. Muge Cevik, a virologist at the University of St. Andrews, said. In truth, the share of transmission that has occurred outdoors seems to be below 1 percent and may be below 0.1 percent, multiple epidemiologists told me. The rare outdoor transmission that has happened almost all seems to have involved crowded places or close conversation.

Saying that less than 10 percent of Covid transmission occurs outdoors is akin to saying that sharks attack fewer than 20,000 swimmers a year. (The actual worldwide number is around 150.) It’s both true and deceiving.

Author(s): David Leonhardt

Publication Date: 11 May 2021

Publication Site: NY Times