The Myth of the Disease-Ridden Red States

Link: https://brownstone.org/articles/the-myth-of-the-disease-ridden-red-states/

Graphic:
Excerpt:

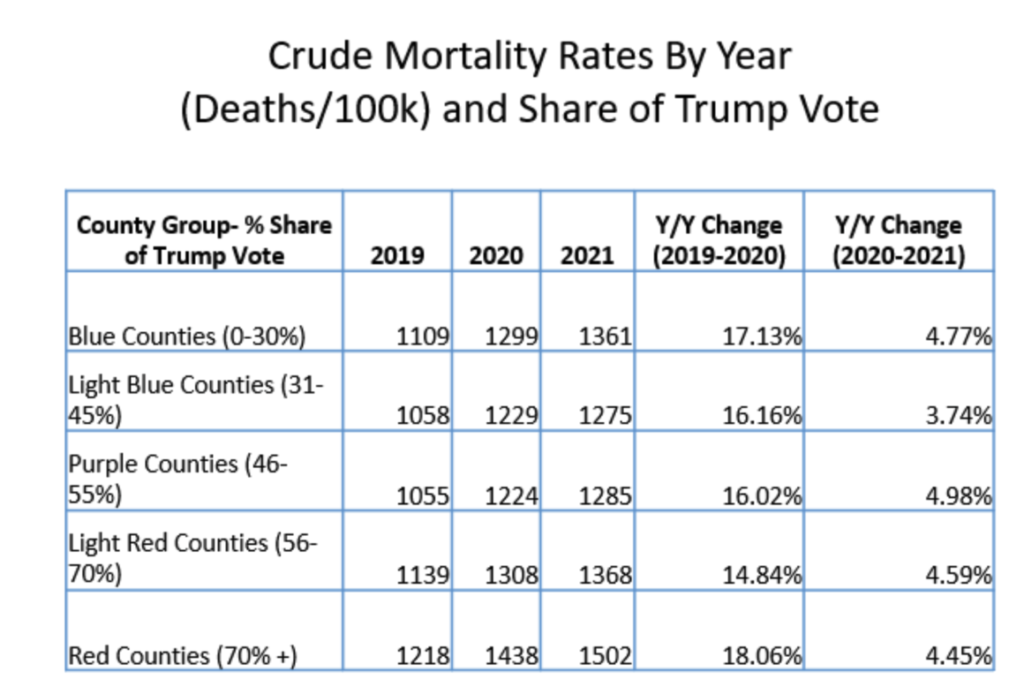
Another way of looking at this is to look at the Year over Year change of rates within each group. As you can see from the chart below, the percentage change remains pretty consistent among each individual grouping, with 2020 seeing the largest change rate, and 2021 seeing a small but significant change rate from 2020 (meaning overall mortality was still quite elevated relative to 2019).

In summary, when we take a historical view and higher level view while maintaining these same groupings, these stark differences in Covid-19 mortality rates do not seem to translate into overall morality rates. Why?


At the risk of this analysis turning into another pile-on pointing out the New York Time’s errors, I’d like to offer a more benign explanation. It’s one that has plagued journalists and reports throughout the pandemic. Why is it that everything is framed in Red and Blue? One simple reason: the availability of the data. Leonhardt is using data that is easily accessible and is already formatted for easy analysis.

This is what is called an availability bias. It’s essentially creating a hypothesis or completing a study based on a specific set of data, purely for no other reason than that the data is there. Just because the data is available does not mean it’s the best data to use to try to answer a question.

Author(s): Josh Stevenson

Publication Date: 3 June 2022

Publication Site: Brownstone Institute
2021 U.S. Mortality News Explainer: Life Expectancy, Death Rates, and More

Link:https://marypatcampbell.substack.com/p/2021-us-mortality-news-explainer?s=w

Graphic:

Excerpt:

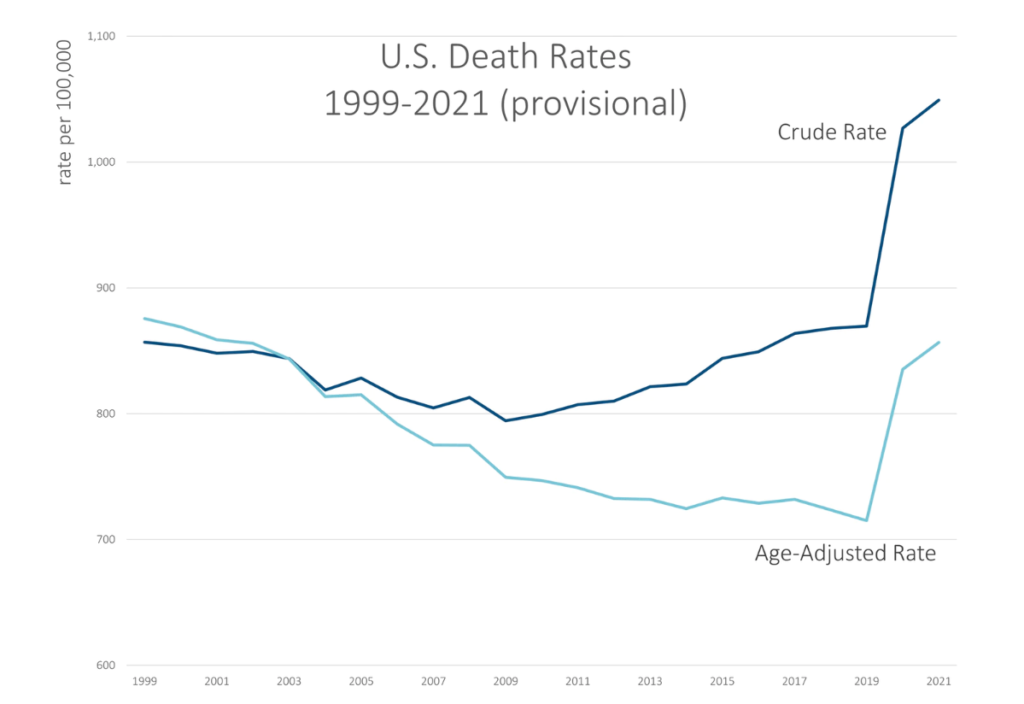
Here’s a graph for 1999 through the provisional 2021 result (as of 3 April 2022 data from CDC WONDER):

You can see the crude rate is higher than the age-adjusted rate for most of the years, and that’s due to the aging of the population. Basically, the Boomers have been getting older, and their older ages (and higher mortality compared to where they were in 2000), have an effect on how many deaths there are overall — thus the crude rate continually increasing as there are more and more old people.

However, until the pandemic hit, the age-adjusted death rate in general decreased, though we had a few years in the 2010s in which the age-adjusted death rate did increase… and yes, that was due to drug overdoses. We will get to that in a bit.

In any case, both the crude rate and age-adjusted rates did jump up by a lot in 2020 due to the pandemic, and COVID deaths were even higher in 2021. But there were other causes of death also keeping mortality rates high in 2021.

I will point out that even with all this extra mortality, the age-adjusted death rate in 2021 is still below where it was in 1999.

That does not mean things are hunky-dory.

This is one of the dangers of collapsing death rates into a single number. The increase in death rates has differed by age group, and it has been far worse for teens and young adults through even young middle-age than it has been for the oldest adults.

Yes, COVID has killed the oldest adults the most, but their death rates have increased the least. It’s all relative.

Author(s): Mary Pat Campbell

Publication Date: 13 Apr 2022

Publication Site: STUMP at substack

Mortality Basics with Meep: Age-Adjusted Death Rates v. Crude Death Rates for U.S. 1968-2020

Link: https://marypatcampbell.substack.com/p/mortality-basics-with-meep-age-adjusted

Graphic:

Excerpt:

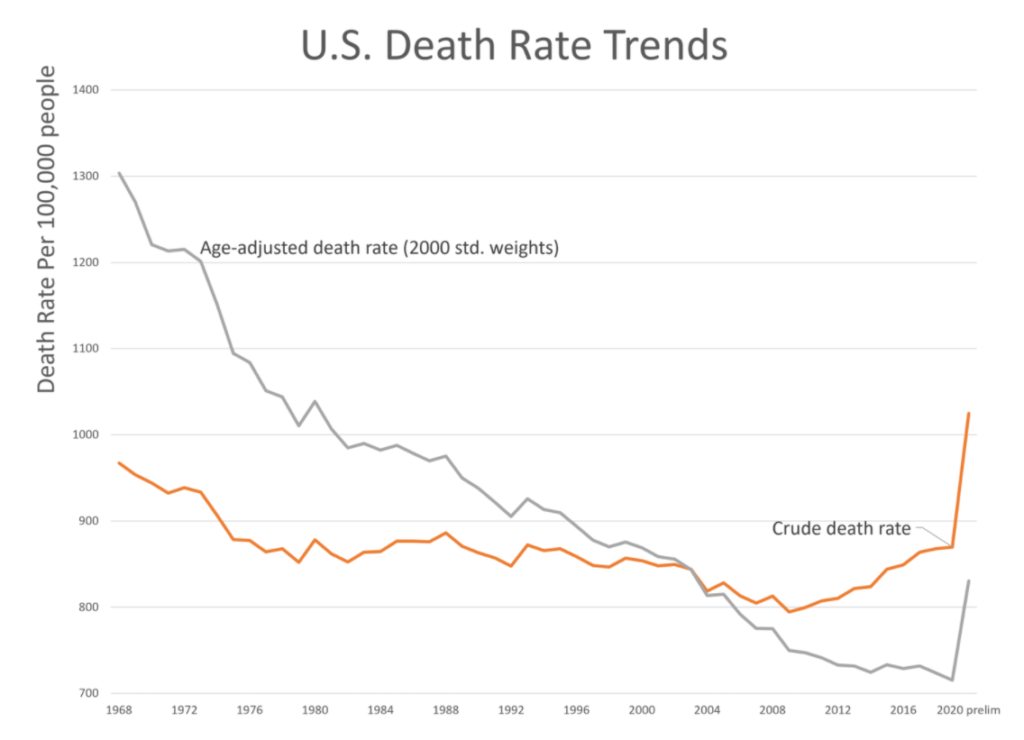
The crude death rate in 2019, pre-pandemic, was 870 per 100,000 people.

There was a similar crude death rate in 1989 (871 per 100,000) — do we really believe that the mortality experience, across the board, was the same thirty years apart?

This is the reason there is the same crude death rate in the two years: the age structure of the population was very different.

….

The main point, though, was that the population skewed younger in 1989 than in 2019. The median age in the U.S. was 38.4 in 2019. It was 32.9 years old in 1989.

In 1989, only 12.4% of the population was age 65 or older. In 2019, we had 16.5% of the population in that age bucket.

The changing age structure means that one can have mortality rates trending down for all ages, but the crude death rate climbs because the population is getting older. It’s definitely driven by people living longer (due to those lower mortality rates), but also driven by fewer babies being born.

Author(s): Mary Pat Campbell

Publication Date: 28 July 2021

Publication Site: STUMP at substack