Unhelpful, inflammatory Jama Network Open paper suggests that people in Red states dream up vaccine injuries

Link:https://www.drvinayprasad.com/p/unhelpful-inflammatory-jama-network?utm_source=post-email-title&publication_id=231792&post_id=143191018&utm_campaign=email-post-title&isFreemail=true&r=9bg2k&triedRedirect=true&utm_medium=email

Graphic:

Excerpt:

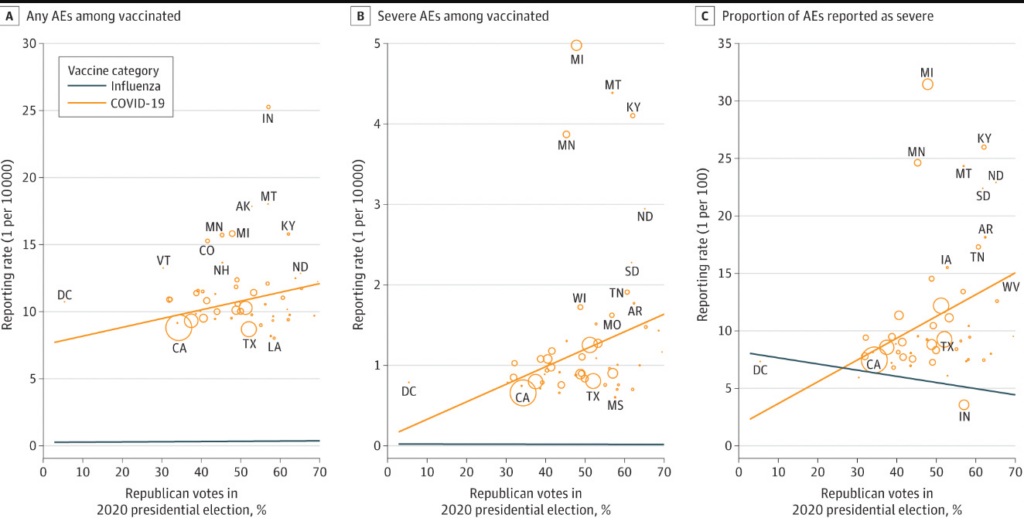
Now let’s turn to the paper. Here is what the authors find (weak correlation btw voting and vaccine injuries) , and here are the issues.

  1. These data are ecological. It doesn’t prove that republicans themselves are more likely to report vaccine injuries. It would not be difficult to pair voting records with vaccine records at an individual patient level if the authors wished to do it right— another example of research laziness.
  2. What if republicans actually DO have more vaccine injuries? The authors try to correct for the fact by adjusting for influenza adverse events.

Let me explain why this is a poor choice. The factors that predict whether someone has an adverse event to influenza vaccine may not be the same as those that predict adverse events from covid shots. It could be that there are actually more covid vaccine injuries in one group than another— even though both had equal rates of influenza injuries.

Another way to think of it is, there can be two groups of people and you can balance them by the rate with which they get headaches from drinking wine, but one group can be more likely to get headaches from reading without glasses because more people in that group wear glasses. In other words, states with more republicans might be states with specific co-morbidities that predict COVID vaccine adverse side effects but not influenza vaccine side effects. We already know that COVID vaccine injuries do affect different groups (young men, for e.g.).

Author(s): Vinay Prasad

Publication Date: 2 Apr 2024

Publication Site: Vinay Prasad’s Thoughts and Observations at substack
Regulatory Capital Adequacy for Life Insurance Companies

Link: https://www.soa.org/4a194f/globalassets/assets/files/resources/research-report/2023/erm-191-reg-capital-with-final-visuals.pdf

Graphic:

Excerpt:

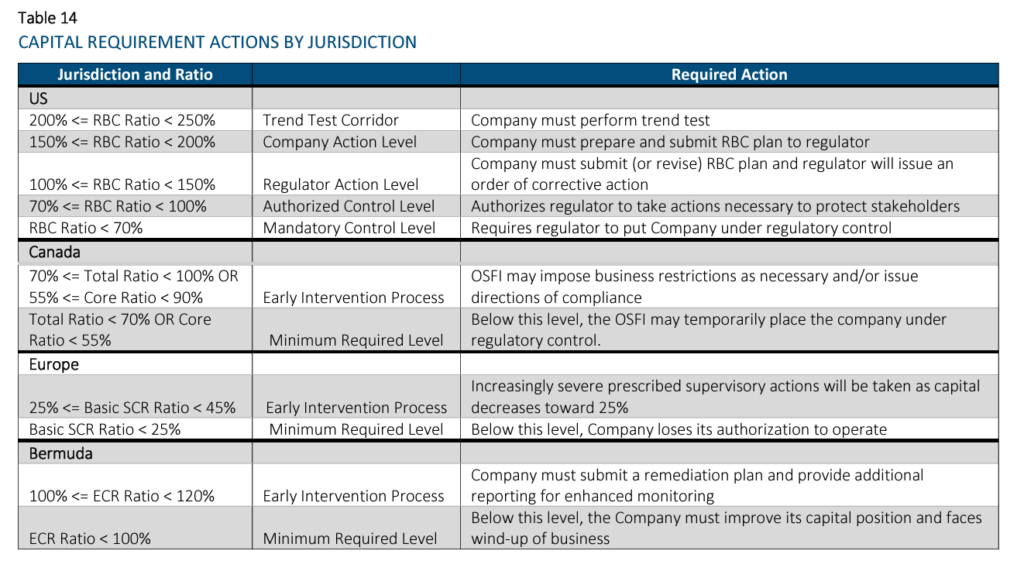
The purpose of this paper is to introduce the concept of capital and key related terms, as well as to compare and contrast four key regulatory capital regimes. Not only is each regime’s methodology explained with key terms defined and formulas provided, but illustrative applications of each approach are provided via an example with a baseline scenario. Comparison among these capital regimes is also provided using this same model with two alternative scenarios.

The four regulatory required capital approaches discussed in this paper are National Association of Insurance Commissioners’ (NAIC) Risk-Based Capital (RBC; the United States), Life Insurer Capital Adequacy Test (LICAT; Canada), Solvency II (European Union), and the Bermuda Insurance Solvency (BIS) Framework which describes the Bermuda Solvency Capital Requirement (BSCR). These terms may be used interchangeably. These standards apply to a large portion of the global life insurance market and were chosen to give the reader a better understanding of how required capital varies by jurisdiction, and the impact of the measurement method on life insurance company capital.

All of these approaches are similar in that they identify key risks for which capital should be held (e.g., asset default and market risks, insurance risks, etc.). However, they differ in significant ways too, including their defined risk taxonomy and risk diversification / aggregation methodologies, as well as required minimum capital thresholds and corresponding implications. Another key difference is that the US’s RBC methodology is largely factor-based, while the other methodologies are model-based approaches. For the model-based approaches, Solvency II and BIS allow for the use of internal models when certain conditions are satisfied. Another difference is that the RBC methodology is largely derived using book values, while the others use economic-based measurements.

As mentioned above, this paper provides a model that calculates the capital requirements for each jurisdiction. The model is used to compare regulatory solvency capital using identical portfolios for both assets and liabilities. For simplicity, we have assumed that all liabilities originated in the same jurisdiction as the calculation. As the objective of the model is to illustrate required capital calculation methodology differences, a number of modeling simplifications were employed and detailed later in the paper. The model considers two products – term insurance and payout annuities, approximately equally weighted in terms of reserves. The assets consist of two non-callable bonds of differing durations, mortgages, real estate, and equities. Two alternative scenarios have been considered, one where the company invests in riskier assets than assumed in the base case and one where the liability mix is more heavily weighted to annuities as compared to the base case.

Author(s): Ben Leiser, FSA, MAAA; Janine Bender, ASA, MAAA; Brian Kaul

Publication Date: July 2023

Publication Site: Society of Actuaries

On the Limitations of Dataset Balancing: The Lost Battle Against Spurious Correlations

Link: https://arxiv.org/abs/2204.12708

PDF: https://aclanthology.org/2022.findings-naacl.168.pdf

Findings of the Association for Computational Linguistics: NAACL 2022, pages 2182 – 2194
July 10-15, 2022

Graphic:

Abstract:

Recent work has shown that deep learning models in NLP are highly sensitive to low-level correlations between simple features and specific output labels, leading to overfitting and lack of generalization. To mitigate this problem, a common practice is to balance datasets by adding new instances or by filtering out “easy” instances (Sakaguchi et al., 2020), culminating in a recent proposal to eliminate single-word correlations altogether (Gardner et al., 2021). In this opinion paper, we identify that despite these efforts, increasingly-powerful models keep exploiting ever-smaller spurious correlations, and as a result even balancing all single-word features is insufficient for mitigating all of these correlations. In parallel, a truly balanced dataset may be bound to “throw the baby out with the bathwater” and miss important signal encoding common sense and world knowledge. We highlight several alternatives to dataset balancing, focusing on enhancing datasets with richer contexts, allowing models to abstain and interact with users, and turning from large-scale fine-tuning to zero- or few-shot setups.

Author(s): Roy Schwartz, Gabriel Stanovsky

Publication Date: July 2022

Publication Site: arXiV

Modern Portfolio Theory Faces Issues As Correlations Turn Positive

Link: https://www.thewealthadvisor.com/article/modern-portfolio-theory-faces-issues-correlations-turn-positive?mkt_tok=NDQ2LVVIUy0wMTMAAAF_mViiBJO-qrg7D4DudMyxmY2hssLidn3lEOlX-kAIh3R_yylYhWdr5_fo6QtLbdN1_nODniHhefsm5_gZSApaxmU5Rf8Kz5XOyKg-v1SmPwQe

Graphic:

Excerpt:

However, Modern Portfolio Theory may have a problem going forward. Don’t worry, we are not going to hack on bonds based on a fear that yields may rise in the future, creating a portfolio drag. There are already enough bond haters out there. The issue we are seeing goes beyond just the bond argument – correlations have been rising just about everywhere. In today’s world, correlations have been changing, with more and more asset classes becoming increasingly correlated. The problem: when the correlations between investments are higher, it becomes harder to diversify risk in a portfolio.

Let’s start with the big one, global bonds and global equities. Combining equities and bonds has benefitted from a generally negative correlation for much of the past few decades. However, this correlation has turned positive of late (chart 1), implying reduced diversification benefits when combining bonds and equities. This isn’t too much of a concern, given that the long-term average is slightly positive.

But don’t throw out your bonds just yet. This correlation tends to return to be strongly negative during risk-off periods in the equity markets. This reflex action during corrections helps maintain bonds in portfolios, even if they experience periods of low or even negative performance.

Publication Date: 15 Sept 2021

Publication Site: The Wealth Advisor

Music Sentiment and Stock Returns Around the World

Link: https://papers.ssrn.com/sol3/papers.cfm?abstract_id=3776071

Graphic:

Excerpt:

This paper introduces a real-time, continuous measure of national sentiment that is language-free and thus comparable globally: the positivity of songs that individuals choose to listen to. This is a direct measure of mood that does not pre-specify certain mood-affecting events nor assume the extent of their impact on investors. We validate our music-based sentiment measure by correlating it with mood swings induced by seasonal factors, weather conditions, and COVID-related restrictions. We find that music sentiment is positively correlated with same-week equity market returns and negatively correlated with next-week returns, consistent with sentiment-induced temporary mispricing. Results also hold under a daily analysis and are stronger when trading restrictions limit arbitrage. Music sentiment also predicts increases in net mutual fund flows, and absolute sentiment precedes a rise in stock market volatility. It is negatively associated with government bond returns, consistent with a flight to safety.

Author(s):

Alex Edmans
London Business School – Institute of Finance and Accounting; European Corporate Governance Institute (ECGI); Centre for Economic Policy Research (CEPR)

Adrian Fernandez-Perez
Auckland University of Technology

Alexandre Garel
Audencia Business School

Ivan Indriawan
Auckland University of Technology – Department of Finance

Publication Date: 14 Aug 2021

Publication Site: SSRN, Journal of Financial Economics (forthcoming)

An Alternative to the Correlation Coefficient That Works For Numeric and Categorical Variables

Link: https://rviews.rstudio.com/2021/04/15/an-alternative-to-the-correlation-coefficient-that-works-for-numeric-and-categorical-variables/

Graphic:

Excerpt:

Using an insight from Information Theory, we devised a new metric – the x2y metric – that quantifies the strength of the association between pairs of variables.

The x2y metric has several advantages:

It works for all types of variable pairs (continuous-continuous, continuous-categorical, categorical-continuous and categorical-categorical)

It captures linear and non-linear relationships

Perhaps best of all, it is easy to understand and use.

I hope you give it a try in your work.

Author(s): Rama Ramakrishnan

Publication Date: 15 April 2021

Publication Site: R Views

Ahead of the curve: Modelling the unmodellable

Link: https://www.ipe.com/home/ahead-of-the-curve-modelling-the-unmodellable/10051869.article

Graphic:

Excerpt:

In his youth, the economist Kenneth Arrow analysed weather forecasts for the US Army. When he found that the predictions were as reliable as historical averages, he suggested reallocating manpower. The response from the army general’s office? “The general is well aware that your division’s forecasts are worthless. However, they are required for planning purposes.”

Even before COVID-19, many shared that scepticism of forecasts. The failure to foresee the 2008-09 financial crisis started a debate on economic modelling. Over the past year, the performance of epidemiological models has not resolved this quandary.

Investors have long known that “all models are wrong, but some are useful,” to use the statistician George Box’s pithy idiom. But, there are modellers who use this defence to preserve models beyond usefulness. Meanwhile, there are unrealistic expectations from consumers of models including investors, policymakers and society. They assume that complex issues are easy to forecast, when some things are just unknowable. This gap begs the question of what investors should do.

Author(s): Sahil Mahtani

Publication Date: April 2021

Publication Site: Investments & Pensions Europe

Associations Between Governor Political Affiliation and COVID-19 Cases, Deaths, and Testing in the U.S.

Link: https://www.ajpmonline.org/article/S0749-3797(21)00135-5/fulltext

DOI: https://doi.org/10.1016/j.amepre.2021.01.034

Graphic:

Excerpt:

Results: From March to early June, Republican-led states had lower COVID-19 incidence rates compared with Democratic-led states. On June 3, the association reversed, and Republican-led states had higher incidence (RR=1.10, 95% PI=1.01, 1.18). This trend persisted through early December. For death rates, Republican-led states had lower rates early in the pandemic, but higher rates from July 4 (RR=1.18, 95% PI=1.02, 1.31) through mid-December. Republican-led states had higher test positivity rates starting on May 30 (RR=1.70, 95% PI=1.66, 1.73) and lower testing rates by September 30 (RR=0.95, 95% PI=0.90, 0.98).

Author(s): Brian Neelon, PhD; Fedelis Mutiso, MS; Noel T. Mueller, PhD, MPH; John L. Pearce, PhD; Sara E. Benjamin-Neelon, PhD, JD, MPH

Publication Date: 9 March 2021

Publication Site: American Journal of Preventive Medicine