Link: https://content.naic.org/research_moody.htm
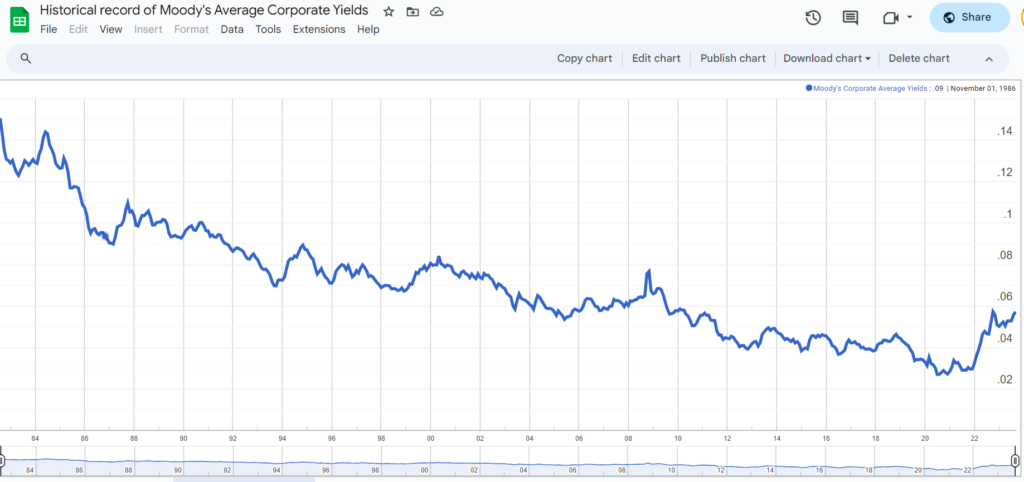
Excerpt: September 2023: 5.72%
Graphic:

Publication Date: accessed 11 Oct 2023
Publication Site: NAIC
All about risk
Link: https://content.naic.org/research_moody.htm
Excerpt: September 2023: 5.72%
Graphic:

Publication Date: accessed 11 Oct 2023
Publication Site: NAIC
Graphic:

Excerpt:
Everyone knows, or at least should know, that the “Big 3” rating agencies that rate about 98 percent of all debt all issue trash ratings. Here’s the background on how that happened.
Rating agencies used to get paid by investors on the basis of how well they did at estimating the likelihood of default. The better your ratings, the more sought out your opinions.
In the mid 1970s, the SEC created nationally recognized statistical ratings organizations (NRSROs). Following that idiotic regulation, the rating agencies got paid on the basis of how much debt they rated, not how accurate their ratings were. Fees come from corporations issuing debt, not investors seeking true default risk.
The more stuff you rate AAA, the more business you get from companies who want their debt rated. The new model is ass backward, and why ratings are trash. A genuine fiasco happened with ratings during the Great Financial Crisis with tons of garbage rated AAA went to zero.
There should not be NRSROs. The SEC made matters much worse, except of course for the Big 3 who have a a captured, mandated audience, coupled with massive conflicts of interest.
Author(s): Mike Shedlock
Publication Date: 5 Aug 2023
Publication Site: Mish Talk
Graphic:

Excerpt:
As corporate bonds are mainly fixed rate, their relative value will decrease as floating rate investments
become more attractive with higher benchmark rates. That is, bond prices will fall as yields rise to make
them more attractive, given that their fixed-rate coupons will be lower. About half of insurer bond
investments are corporate bonds, and the vast majority of U.S. insurer corporate bond investments are
investment grade credit quality. From January 2022 to January 2023, the ICE Bank of America (BofA)
Investment Grade Corporate Bond Index, which measures the performance of investment grade
corporate debt, was down by about 14%.
Corporate bond yields have increased significantly since the beginning of 2022 with rising interest rates
and widening credit spreads. As of year-end 2022, investment grade and high-yield corporate bond
yields averaged 5.5% and 8.9%, respectively (refer to Table 1). Investment grade yields increased by
approximately 270 bps during 2022, while speculative-grade yields increased by about 370 bps.
Author(s): Jennifer Johnson and Michele Wong
Publication Date: 23 Feb 2023
Publication Site: NAIC Capital Markets Special Report
Link: https://content.naic.org/research_moody.htm
Historical record: https://docs.google.com/spreadsheets/d/1Sgi6XVzK0_sCtAWuCnUD02eObOTC3S4xlQgMep32OeU/edit?usp=sharing
Graphic:

Publication Date: accessed 9 Dec 2022
Publication Site: NAIC
Link: https://content.naic.org/sites/default/files/capital-markets-special-reports-PE-owned-YE2021.pdf
Graphic:

Excerpt:
The BACV of total cash and invested assets for PE-owned insurers was about 6% of the U.S. insurance
industry’s $8.0 trillion at year-end 2021, down slightly from 6.5% of total cash and invested assets at
year-end 2020. The number of PE-owned insurers, however, increased to 132 in 2021 from 117 in 2020,
but they were about 3% of the total number of legal entity insurers at both year-end 2021 and year-end 2020.Consistent with prior years, U.S. insurers have been identified as PE-owned via a manual process.
That is, the NAIC Capital Markets Bureau identifies PE-owned insurers to be those who reported any
percentage of ownership by a PE firm in Schedule Y, and other means of identification such as using
third-party sources, including directly from state regulators. As such, the number of U.S. insurers that
are PE-owned continues to evolve.1
Life companies continue to account for a significant proportion of PE-owned insurer investments at
year-end 2021, at 95% of total cash and invested assets (see Table 1). This represents a small decrease
from 97% at year-end 2020 (see Table 2). Notwithstanding, there was a slight increase in PE-owned
insurer investments for property/casualty (P/C) companies, to 4% at year-end 2021, compared to 3% the
prior year. In addition, there was also a small increase in total BACV for PE-owned title and health
companies’ investments, at about $1.1 billion at year-end 2021, compared to under $1 billion at yearend 2020.
Author(s): Jennifer Johnson and Jean-Baptiste Carelus
Publication Date: 19 Sept 2022
Publication Site: NAIC Special Capital Markets Reports
Link:https://content.naic.org/sites/default/files/capital-markets-hotspot-New-Inflation-High-Feb-2022.pdf
Graphic:

Excerpt:
While U.S. insurance companies have adapted to investing in a world of low interest rates, they are now
also facing the challenge of investing in a high inflationary environment whereby yields may not be
providing adequate returns on investment on an inflation-adjusted basis. Using a similar approach to
estimating real interest rates in Chart 1, we estimate how corporate bond yields are holding up against
high inflation….
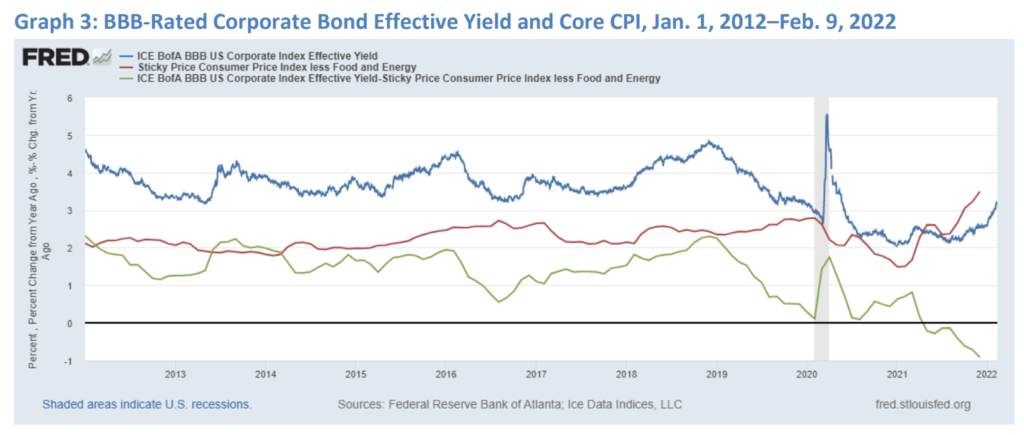
Graph 3 shows similar data for BBB-rated corporate bonds. With BBB yields generally higher than A
yields, the difference between the two measures has been negative for a shorter period of time. Real
yields did not turn negative until May 2021, and they dipped to almost -1% in December 2021.
Author(s): Michele Wong and Jennifer Johnson
Publication Date: 15 Feb 2022
Publication Site: NAIC Capital Markets Bureau Hot Spot