Disparities Grow as Smoking Rates Rise Again

Link: https://americaninequality.substack.com/p/smoking-and-inequality?utm_source=post-email-title&publication_id=267573&post_id=138207076&utm_campaign=email-post-title&isFreemail=true&r=15zk5&utm_medium=email

Graphic:

Excerpt:

South Dakota is home to 3 of the 5 counties with the highest percent of cigarette smokers. We’ve written about one of those counties, Oglala Lakota County, several times before as it has the lowest life expectancy of any county in the US (residents die at 67 on average), and median income is $30,347. Meanwhile, Utah is home to 6 of the 10 counties with the lowest percent of cigarette smokers. American Inequality has covered several of these counties before. For example, Summit County has the highest life expectancy of any county in the US (residents die at 87 on average), and median income is 2.5x higher than in Oglala. 

Cigarette smoking is 50% higher than in the following 12 states compared to the rest of the nation: Alabama, Arkansas, Indiana, Kentucky, Louisiana, Michigan, Mississippi, Missouri, Ohio, Oklahoma, Tennessee and West Virginia. An average smoker in these 12 states goes through about 53 packs in one year, compared with an average of 29 packs in the rest of the US. Life expectancy is 3 years lower in these states compared to the national average. 

In 1998, California became the first state to implement a smoke free law prohibiting smoking in all indoor areas of bars and restaurants, as well as in most indoor workplaces. As we can see from the map above, California now has one of the lowest percent of adults smoking in the country. 

Author(s): Jeremy Ney

Publication Date: 25 October 2023

Publication Site: American Inequality
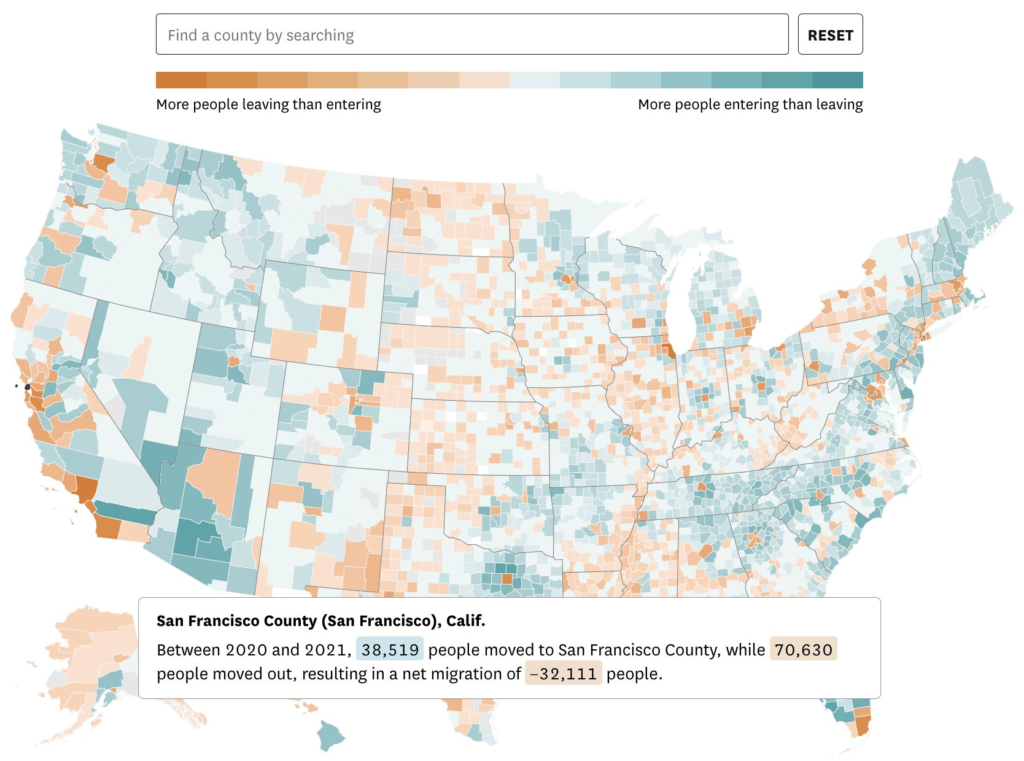
S.F. wasn’t the only city to see an exodus. These maps show the most detailed info on where people are moving

Link: https://www.sfchronicle.com/projects/2023/maps-migration/

Tweet:

Graphic:

Author(s): Nami Sumida

Publication Date: 2 Jun 2023 (also 31 May 2023) accessed 7 Jun 2023

Publication Site: San Francisco Chronicle

The most common restaurant cuisine in every state, and a chain-restaurant mystery

Link: https://www.washingtonpost.com/business/2022/09/29/chain-restaurant-capitals/

Graphic:

Excerpt:

The places that drive the most tend to have the same high share of chain restaurants regardless of whether they voted for Trump or Biden. As car commuting decreases, chain restaurants decrease at roughly the same rate, no matter which candidate most residents supported.

If the link between cars and chains transcends partisanship, why does it look like Trump counties have more chain restaurants? It’s at least in part because he won more of the places with the most car commuters!

About 83 percent of workers commute by car nationally, but only 80 percent of folks in Biden counties do so, compared with 90 percent of workers in Trump counties. The share of car commuters ranges from 55 percent in the deep-blue New York City metro area to 96 percent around bright red Decatur, Ala.

Author(s): Andrew Van Dam

Publication Date: 1 Oct 2022

Publication Site: WaPo

Where Do People Pay the Most in Property Taxes?

Link: https://taxfoundation.org/property-taxes-by-state-county-2022/

Graphic:

Excerpt:

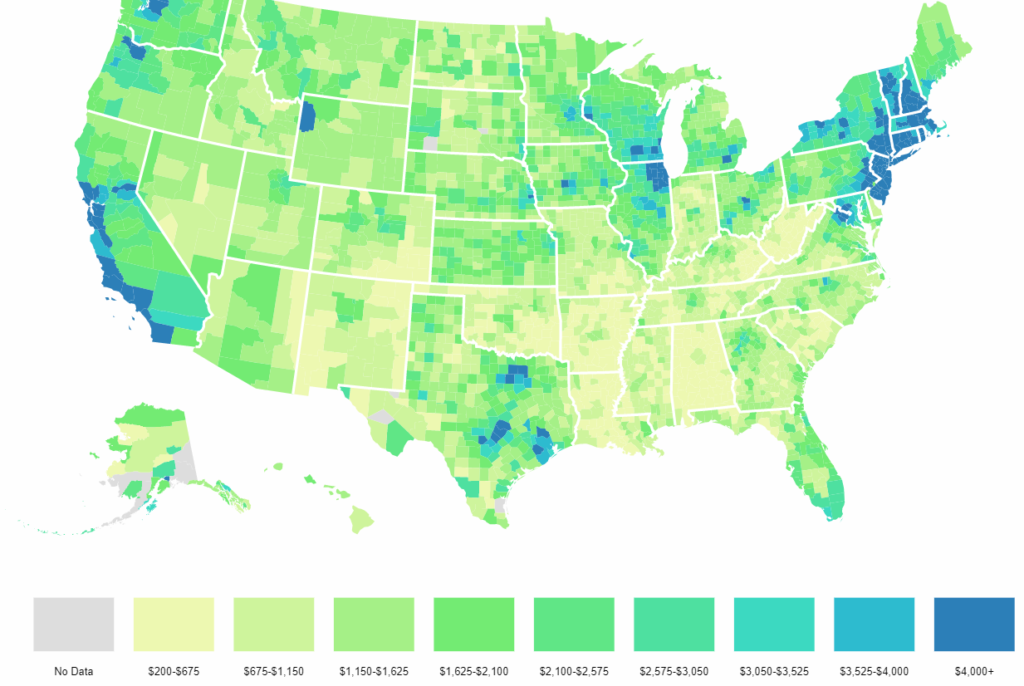
Median property taxes paid vary widely across (and within) the 50 states. The lowest bills in the country are in six counties or county equivalents with median property taxes of less than $200 a year:

  • Northwest Arctic Borough and the Kusivlak Census Area (Alaska)*
  • Avoyelles, East Carroll, and Madison (Louisiana)
  • Choctaw (Alabama)

(*Significant parts of Alaska have no property taxes, though most of these areas have such small populations that they are excluded from federal surveys.)

The next-lowest median property tax of $201 is found in Allen Parish, near the middle of Louisiana, followed by $218 in McDowell County, West Virginia, in the southernmost part of the state.

The eight counties with the highest median property tax payments all have bills exceeding $10,000:

  • Bergen, Essex, and Union (New Jersey)
  • Nassau, New York, Rockland, and Westchester (New York)
  • Falls Church (Virginia)

All but Falls Church are near New York City, as is the next highest, Passaic County, New Jersey ($9,999). 

Author(s): Janelle Fritts

Publication Date: 13 Sept 2022

Publication Site: Tax Foundation

Four(plus) Ways to Visualize Geographic Time Data

Link: https://policyviz.com/2021/05/11/fourplus-ways-to-visualize-geographic-time-data/

Graphic:

Excerpt:

The last visualization I tried was to really embrace the idea of time in the data. Instead of a map or bar chart or something else, I placed the state abbreviations around two clock faces. I know it sounds weird, but take a look at the final version.

I think this is a fun visualization, and it communicates more precisely the exact average starting times than the previous graphs. The two clocks could be combined to one, but I worry it’s not quite as clear, so I tried using the different colors to differentiate the two hours.

Author(s): Jon Schwabish

Publication Date: 11 May 2021

Publication Site: PolicyViz