Why the life insurance industry did not face an “S&L-type” crisis

Link: https://econpapers.repec.org/article/fipfedhep/y_3a1993_3ai_3asep_3ap_3a12-24_3an_3av.17no.5.htm

PDF link: https://econpapers.repec.org/scripts/redir.pf?u=http%3A%2F%2Fwww.chicagofed.org%2Fdigital_assets%2Fpublications%2Feconomic_perspectives%2F1993%2Fep_sep_oct1993_part2_brewer.pdf;h=repec:fip:fedhep:y:1993:i:sep:p:12-24:n:v.17no.5

Full reference:

Elijah BrewerThomas H. Mondschean and Philip E. Strahan

Economic Perspectives, 1993, vol. 17, issue Sep, 12-24

Graphic:

Excerpt:

In most states, coverage under guaranty

funds is $300,000 in death benefits, $100,000 in

cash or withdrawal value for life insurance,

$100,000 in present value of annuity benefits,

and $100,000 in health benefits. Some states

cover all insurance policies written by an insol-

vent firm located in the state; others cover the

policies of residents only. In the case of unallo-

cated annuities such as GICs purchased by com-

panies to fund pension plans, some states cover

up to a certain amount, usually $5 million. Oth-

er states, such as California, Massachusetts, and

Missouri, do not cover GICs.

Because of variations in state guaranty

funds and in the way insolvencies are handled,

the parties bearing the costs of an insurance

failure differ across states. Surviving insurance

companies initially pay their assessments and

claim them as an expense on their federal corpo-

rate income tax return, reducing their federal

income taxes. As companies receive tax credits

in subsequent years, these credits become tax-

able income. As a result, the federal government

bears part of the cost of an insolvency since it

does not fully recover the present value of the

tax decrease granted in the assessment year. In

states with premium tax offsets, however, the

majority of the cost is paid by state taxpayers.

A study of 1990 life/health guaranty fund assess-

ments found that 73.6 percent was paid by state

taxpayers, 8.9 percent by federal taxpayers, and

17.5 percent by the equity holders of the surviv-

ing firms.

Author(s): Elijah BrewerThomas H. Mondschean and Philip E. Strahan

Publication Date: September 1993

Publication Site: Economic Perspectives, Chicago Fed
Private Overborrowing Under Sovereign Risk

Link: https://www.chicagofed.org/publications/working-papers/2022/2022-17

Graphic:

Abstract:

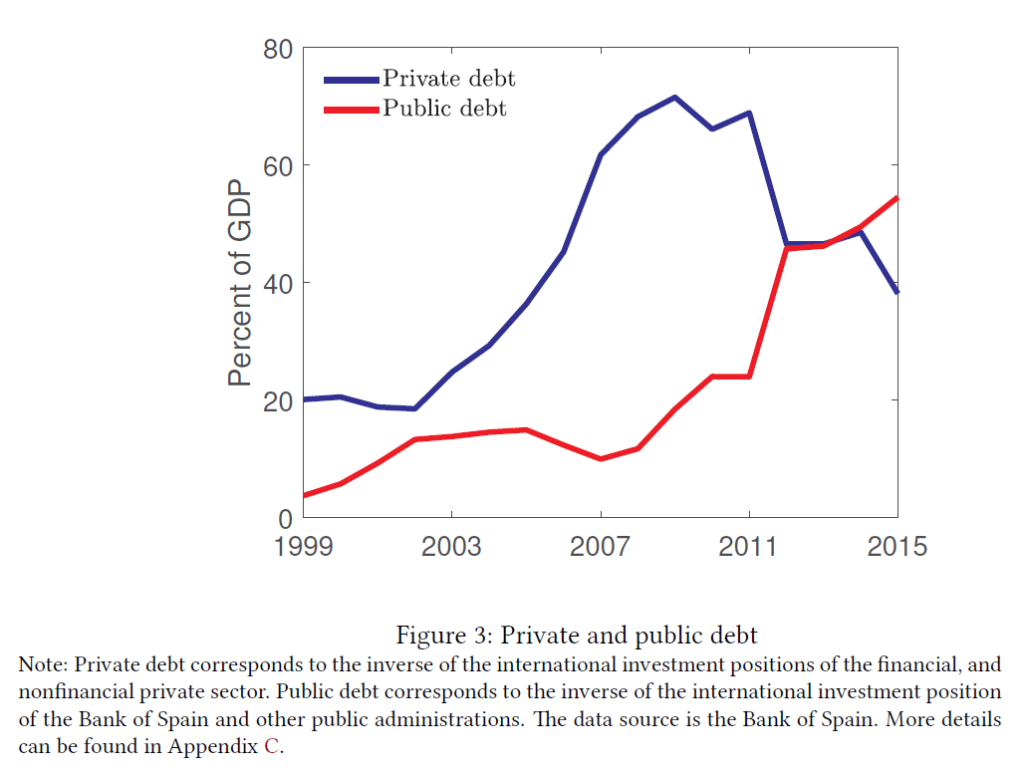
This paper proposes a quantitative theory of the interaction between private and public debt in an open economy. Excessive private debt increases the frequency of financial crises. During such crises the government provides fiscal bailouts financed with risky public debt. This response may cause a sovereign debt crisis, which is characterized by a higher probability of a sovereign default. The model is quantitatively consistent with the evolution of private debt, public debt, and sovereign spreads in Spain from 1999 to 2015, and provides an estimate of the degree of overborrowing, its effect on the spreads, and the optimal macroprudential policy.

Author(s): Fernando Arce

Publication Date: May 2022

Publication Site: Chicago Fed

How Vulnerable Are Insurance Companies to a Downturn in the Municipal Bond Market?

Link: https://www.chicagofed.org/publications/chicago-fed-letter/2021/451

Excerpt:

The potential impact of Covid-19 on the municipal bond market

The coronavirus pandemic and the related economic slowdown are expected to cause a persistent drag on state and municipal tax revenues, which may apply pressure to the municipal bond market. Current estimates from the Brookings Institution suggest that, relative to 2019 tax receipts, state and local general revenues will decrease by $155 billion in 2020, $167 billion in 2021, and $145 billion in 2022—or by about 5.5%, 5.7%, and 4.7%, respectively.3 These estimated declines are in line with those experienced during the Great Recession of 2008–09, which averaged 5.8%.4 States face additional budgetary pressures from increased expenditures related to the pandemic, particularly from increased payouts of unemployment insurance (UI) benefits. Between March and October 2020, states paid a record $125.1 billion in UI benefits. The UI benefits paid thus far in 2020 are 30% more than the $96.3 billion in benefits states paid in all of 2009.5 However, states are better positioned to weather these budget stresses than they were prior to the Great Recession due to the increase in state revenue stabilization funds, commonly referred to as “rainy day funds.” At the start of 2020, the median state rainy day fund was equal to 7.8% of state general revenues, compared with 4.6% at the start of 2008.6 This should provide some cushion for the expected decline in revenues due to Covid-19.7 And the second Covid-19 stimulus package signed into law at the close of 2020 is expected to help stabilize state and local budgets and ease stress on municipal bond markets, although direct aid to states and municipalities was removed from the final bill. The bill does provide direct payments to individuals of up to $600, paycheck protection loans for businesses, extended federal UI benefits, $30 billion for vaccine distribution and testing, $54.3 billion for K–12 schools, $22.7 billion for higher education, and $45 billion for transportation-related relief spending. President Joe Biden is proposing $1.9 trillion in additional stimulus spending focused on vaccine distribution, aid to states, and direct benefits to individuals. However, this plan has yet to be enacted and is therefore subject to change. In summary, states and localities are likely to experience significant variation in Covid-19-related revenue declines, and their budgetary strength also varies. As such, certain muni bonds may face downgrades and default.

Authors: Andy Polacek , Shanthi Ramnath

Publication Date: February 2021

Publication Site: Chicago Fed