Do No Harm Guide: Crafting Equitable Data Narratives

Link: https://www.urban.org/research/publication/do-no-harm-guide-crafting-equitable-data-narratives

Graphic:

Excerpt:

KEY FINDINGS

The authors of the 12 essays in this guide work through how to include equity at every step of the data collection and analysis process. They recommend that data practitioners consider the following:

  1. Community engagement is necessary. Often, data practitioners take their population of interest as subjects and data points, not individuals and people. But not every person has the same history with research, nor do all people need the same protections. Data practitioners should understand who they are working with and what they need.
  2. Who is not included in the data can be just as important as who is. Most equitable data work emphasizes understanding and caring for the people in the study. But for data narratives to truly have an equitable framing, it is just as important to question who is left out and how that exclusion may benefit some groups while disadvantaging others.
  3. Conventional methods may not be the best methods. Just as it is important for data practitioners to understand who they are working with, it is also important for them to question how they are approaching the work. While social sciences tend to emphasize rigorous, randomized studies, these methods may not be the best methods for every situation. Working with community members can help practitioners create more equitable and effective research designs.

By taking time to deeply consider how we frame our data work—the definitions, questions, methods, icons, and word choices—we can create better results. As the field undertakes these new frontiers, data practitioners, researchers, policymakers, and advocates should keep front of mind who they include, how they work, and what they choose to show.

Author(s):

(editors) Jonathan Schwabish,
Alice Feng,
Wesley Jenkins

Publication Date: 16 Feb 2024

Publication Site: Urban Institute
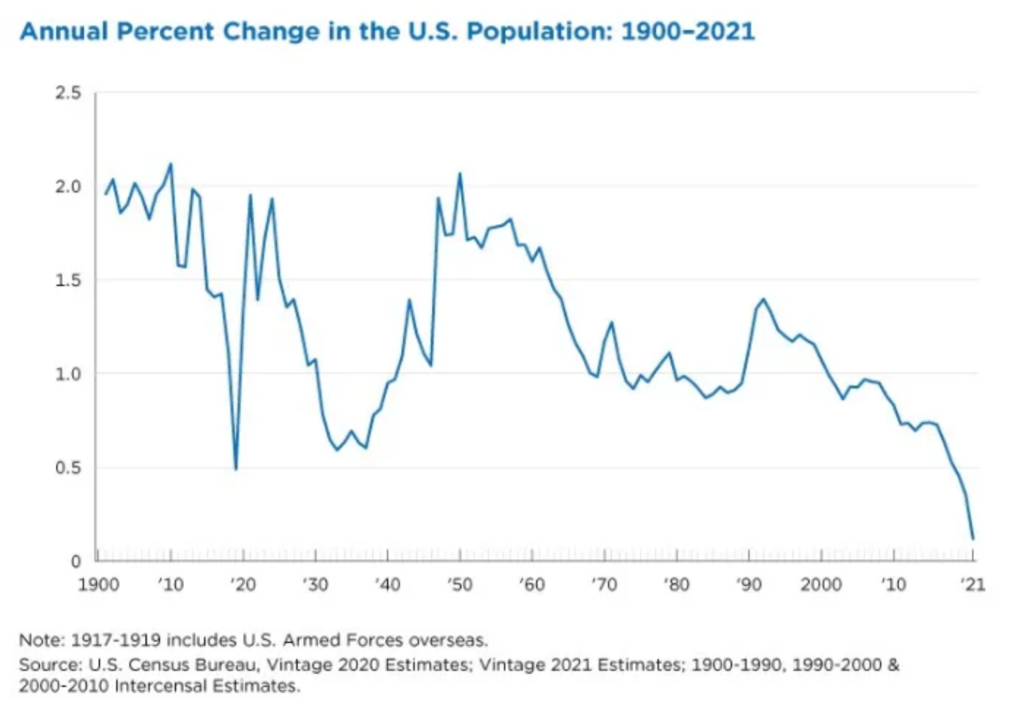
New Census Data Shows Population Increased at Lowest Rate in US History

Link:https://mishtalk.com/economics/new-census-data-shows-population-increased-at-lowest-rate-in-us-history

Graphic:

Excerpt:

The population of the United States grew in the past year by 392,665, or 0.1%, the lowest rate since the nation’s founding. 

The slow rate of growth can be attributed to decreased net international migration, decreased fertility, and increased mortality due in part to the COVID-19 pandemic.

Between July 1, 2020, and July 1, 2021, the nation’s growth was due to natural increase (148,043), which is the number of excess births over deaths, and net international migration (244,622). 

This is the first time that net international migration (the difference between the number of people moving into the country and out of the country) has exceeded natural increase for a given year.

The voting-age resident population, adults age 18 and over, grew to 258.3 million, comprising 77.8% of the population in 2021.

Author(s): Mike Shedlock

Publication Date: 21 Dec 2021

Publication Site: Mish Talk

A Preliminary Analysis of U.S. and State-Level Results From the 2020 Census

Link: https://www.census.gov/library/working-papers/2021/demo/POP-twps0104.html

Graphic:

Choropleth of change in population by state (plus DC & Puerto Rico), 2010-2020

Description:

This paper considers the 2020 Census national and state-level resident population counts in historical and evaluative contexts. By comparing the first results of the 2020 Census against benchmark data sources, we examine how the nation has changed at the highest levels and set the stage for the comprehensive analyses still to come.

Link to paper: https://www.census.gov/content/dam/Census/library/working-papers/2021/demo/pop-twps0104.pdf

Publication Date: 26 April 2021

Publication Site: Census Bureau

China says population grew in 2020 after report of decline

Link: https://apnews.com/article/china-census-2020-business-2dff85f90c7f1bcfb3bfa3fe7fd6ce36

Excerpt:

China’s population grew last year, the government said Thursday, following a report that a census might have found a surprise decline, possibly adding to downward pressure on economic growth.

The National Bureau of Statistics gave no details in its one-sentence statement and said the population figure would be reported later. But the unusual decision to respond to the report by The Financial Times reflected the issue’s political sensitivity.

The Financial Times said people familiar with China’s 2020 census expect it to show the population, which edged above 1.4 billion in 2019, declined for the first time since famine in 1959-61 killed millions of people.

Author(s): JOE McDONALD

Publication Date: 29 April 2021

Publication Site: Associated Press

Is China’s population growing or shrinking? It’s a touchy topic for Beijing

Link: https://fortune.com/2021/04/30/china-population-2020-census-growing-shrinking/

Excerpt:

China’s National Bureau of Statistics (NBS) was scheduled to release the census it conducts once every decade in early April. But in mid-April a government spokesperson said publication of the census had been delayed for an unspecified length of time to allow for “more preparation work.”

China still has not indicated when it may release the report, according to Chinese media.

But on Wednesday, the Financial Times, citing “people familiar with the research,” reported that when published the census will show that China’s population was smaller in 2020 than it was in 2019, the first year-on-year drop in over five decades. In 2019, China reported that its population surpassed 1.4 billion people for the first time, up 4.67 million from the previous year. This year, China’s population fell back down below 1.4 billion, according to the Financial Times.

Author(s): GRADY MCGREGOR

Publication Date: 30 April 2021

Publication Site: Fortune

Finding ‘Anomalies’ Illustrates 2020 Census Quality Checks Are Working

Link: https://www.census.gov/newsroom/blogs/random-samplings/2021/03/finding_anomalies.html?utm_campaign=20210309msc20s1ccpuprs&utm_medium=email&utm_source=govdelivery

Excerpt:

So far in 2020 Census processing, 27 of the 33 anomalies we’ve found are of this type. Let me give a couple of examples.

Miscalculating age for missing birthdays. We found that our system was miscalculating ages for people who included their year of birth but left their birthday and month blank. We fixed this with a simple code correction. Making sure ages calculate correctly helps us with other data processing steps for matching and removing duplicate responses.

Incorrectly sorting out self-responses from group quarters residents. The 2020 Census allowed people to respond online or by phone without using the pre-assigned Census ID that links their response to their address. As a result, some people who live in group quarters facilities, such as nursing homes, were able to respond on their own even though they were also counted through the separate Group Quarters Enumeration operation. This also makes their address show up as a duplicate — as both a group quarters facility and a housing unit. Our business rules sort out these duplicate responses and addresses by accepting the response coming from the group quarters operation and removing the response and address appearing as a housing unit. We found an error in how this rule was being carried out. The code was correctly removing the duplicate address but wasn’t removing the duplicate response. We fixed this with another code correction, which enables us to avoid overcounting these residents. 

Author(s): MICHAEL THIEME, ASSISTANT DIRECTOR FOR DECENNIAL CENSUS PROGRAMS, SYSTEMS AND CONTRACTS

Publication Date: 9 March 2021

Publication Site: U.S. Census Bureau

Same-Sex Couple Households: 2019

Link: https://www.census.gov/library/publications/2021/acs/acsbr-005.html

Graphic:

Excerpt:

This brief highlights the geographic distribution of same-sex couple households, and explores selected characteristics of opposite sex and same-sex couples using data from the 2019 American Community Survey. In addition, the brief examines the presence of children based on couple type.

Author(s): LAQUITTA WALKER AND DANIELLE TAYLOR

Publication Date: 23 February 2021

Publication Site: U.S. Census Bureau

Analyzing Census Data in Excel

Link: https://www.census.gov/data/academy/courses/excel.html

Description

Excel is a very popular tool among all data users. It can be leveraged to unlock the value of open data of all kinds, and it is particularly well-suited to transforming, analyzing, and visualizing Census data. This course will show how to use Excel to access, manipulate, and visualize Census data.  It will also tools for doing advanced statistical analysis.

After completing this course, you will be able to:
    ✓    Access data from the Census Bureau using the American FactFinder
    ✓    Format tables for data analysis
    ✓    Perform basic and advanced analysis of Census data using Excel
    ✓    Create data visualizations such as sparklines, hierarchical charts, and histograms

Author(s): Andy Hecktman, Alexandra Barker

Date Accessed: 27 February 2021

Publication Site: U.S. Census Bureau

States of Growth and Decline

Link: https://www.wsj.com/articles/states-of-growth-and-decline-11609460276

Excerpt:

Sixteen mostly coastal and Rust Belt states lost population from July 2019 to July 2020, according to the Census Bureau’s annual population survey, and Illinois, West Virginia, New York, Connecticut, Mississippi and Vermont have shrunk since 2010. At the same time, many low-tax Sun Belt states have continued to attract newcomers.

The pandemic may have contributed to population losses in some states as city dwellers with means escaped to rental and vacation homes. Foreign immigration also fell after President Trump suspended new green cards in April. Some states, especially in the Northeast, experienced thousands of more deaths than usual due to Covid.

But the bureau’s annual population estimate captures only the first few months of the pandemic when migration generally declined as most people hunkered down. Geographic mobility increased over the summer and fall, and the pandemic seems to have accelerated migration flows that have been occurring for years. States such as New Jersey, Michigan, Pennsylvania and California have counted on foreign immigration offsetting net out-migration. That didn’t happen this year, so many states lost population for the first time in decades.

Author(s): Editorial board

Publication Date: 31 December 2020

Publication Site: Wall Street Journal

Timeline for Releasing Redistricting Data

Link: https://www.census.gov/newsroom/blogs/random-samplings/2021/02/timeline-redistricting-data.html?utm_campaign=20210212msc20s1ccpuprs&utm_medium=email&utm_source=govdelivery

Excerpt:

If this were a typical decade, we would be on the verge of delivering the first round of redistricting data from the 2020 Census. Our original plan was to deliver the data in state groupings starting Feb. 18, 2021 and finishing by March 31, 2021.  

However, COVID-19 delayed census operations significantly. Consistent with previous census, we are focusing first on our constitutional obligation to deliver the state population counts for apportionment to the President. As we announced last week, the deadline for this work is April 30, 2021. This focus on meeting our constitutional obligation has delayed some of the processing activities necessary to generate the redistricting counts.   We expect to deliver the redistricting data to the states and the public by Sept. 30, 2021. 

Author(s): JAMES WHITEHORNE, CHIEF OF THE REDISTRICTING AND VOTING RIGHTS DATA OFFICE

Publication Date: 12 February 2021

Publication Site: U.S. Census

Census Estimates Show Population Decline in 16 States

Link: https://www.pewtrusts.org/en/research-and-analysis/blogs/stateline/2021/01/21/census-estimates-show-population-decline-in-16-states

Excerpt:

With a perfect storm of aging residents, low birth rates, COVID-19 deaths and immigration cutbacks, 16 states saw population decreases last year as the United States experienced the slowest national population growth since the Great Depression.

The nation grew only about 7% between 2010 and 2020, similar to the previous historic low between 1930 and 1940, according to new Census Bureau estimates, which do not reflect the 2020 census counts. The agency will release the final 2020 census tally in March.

Author: Tim Henderson

Publication Date: 21 January 2021

Publication Site: Pew