‘The Premonition’ Review: A Pandemic of Experts

Link: https://www.wsj.com/articles/the-premonition-review-a-pandemic-of-experts-11620078624

Excerpt:

The article, in any case, doesn’t claim that 180,000 people could have been saved by more robust public-health interventions in early 2020 but that those deaths are mostly the result of Americans’ poor health. That the U.S. death rate, even so, is lower than that of the U.K. and Italy and nearly equal to that of France — all G7 nations — rather complicates Mr. Lewis’s breezy thesis.

It is amazing to me that intelligent people in 2021 can survey the past year and conclude that some alternative set of non-pharmaceutical interventions would have made an appreciable difference in the spread of this magnificently resilient virus. But many such people do believe that, including the author of this book and its ostensible heroes. One of those heroes, an accomplished hospital administrator named Carter Mecher, drew up a national pandemic response plan for the George W. Bush administration. The key to stopping dangerous pathogens, he came to believe as he studied pandemic modeling, was closing schools.

….

Here is a point that Mr. Lewis’s heroes show no awareness of grasping: that the United States is a big unruly country in which people are accustomed to going where they please and don’t care for government authorities telling them what to do based on poorly understood “data.” One of the Wolverines, a public-health official in Santa Barbara County named Charity Dean, appears to believe that any sign of a dangerous contagion permits health authorities to assume dictatorial powers. She tells Mr. Lewis that in early 2020 California should have closed its borders “until it figured out exactly how much virus was circulating, and where” and that the U.S. should follow Thailand’s example and require “anyone entering the country to wear a GPS wristband” and so enable the authorities to know who’s disobeying quarantine rules.

Author(s): Barton Swaim

Publication Date: 3 May 2021

Publication Site: Wall Street Journal

Book Link: https://amzn.to/3xLQZzS

Social Security Sees Slowdown in Retiree Rolls Amid Covid Deaths

Link: https://www.bloomberg.com/news/articles/2021-05-03/social-security-sees-slowdown-in-retiree-rolls-amid-covid-deaths

Graphic:

Excerpt:

The rate of growth in retired Americans who collect Social Security has slowed down sharply, and the drop may be due in part to the disproportionate number of deaths from Covid-19 among the elderly.

The number of people who received retirement benefits from the Social Security Administration rose 900,000 to 46.4 million in March, the smallest year-over-year gain since April 2009.

While the Office of the Chief Actuary at the government agency said it is still too early to assess the impact from Covid-19, the year-over-year change appears to reflect excess deaths. About 447,000 people who died from the virus were 65 or older, according to data from the Centers for Disease Control and Prevention, or about 80% of total deaths.

Author(s): Alexandre Tanzi

Publication Date: 3 May 2021

Publication Site: Bloomberg

1918 Influenza: the Mother of All Pandemics

Link: https://wwwnc.cdc.gov/eid/article/12/1/05-0979_article

Graphic:

Abstract:

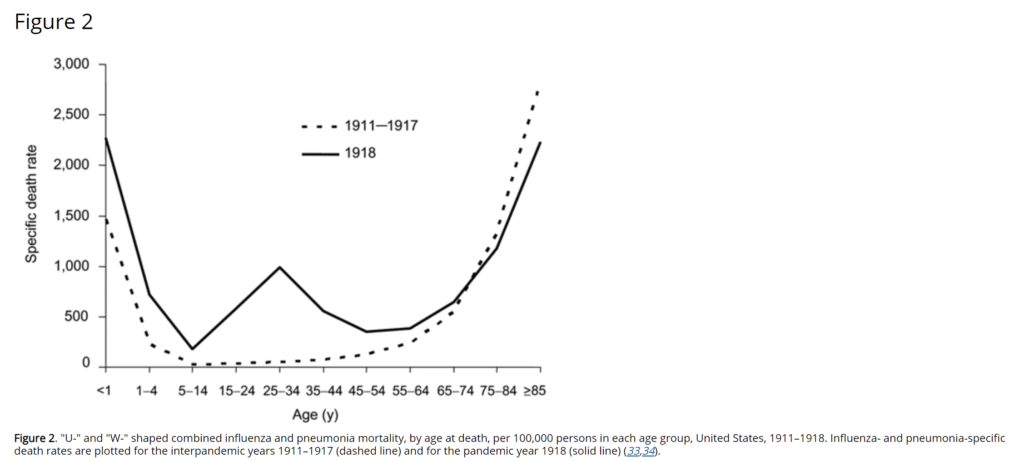
The “Spanish” influenza pandemic of 1918–1919, which caused ≈50 million deaths worldwide, remains an ominous warning to public health. Many questions about its origins, its unusual epidemiologic features, and the basis of its pathogenicity remain unanswered. The public health implications of the pandemic therefore remain in doubt even as we now grapple with the feared emergence of a pandemic caused by H5N1 or other virus. However, new information about the 1918 virus is emerging, for example, sequencing of the entire genome from archival autopsy tissues. But, the viral genome alone is unlikely to provide answers to some critical questions. Understanding the 1918 pandemic and its implications for future pandemics requires careful experimentation and in-depth historical analysis.

Author(s): Jeffery K. Taubenberger, David M. Morens

Publication Date: January 2006

Publication Site: CDC

Covid-19 Cases Rise in Parts of U.S. Even as Vaccinations Pick Up

Link: https://www.wsj.com/articles/u-s-faces-critical-weeks-as-covid-19-cases-rise-again-in-some-places-11618845433

Excerpt:

The Centers for Disease Control and Prevention reported Monday that the seven-day average of new Covid-19 cases is at more than 67,443, up 1% from the prior seven-day average of 66,702. Four weeks ago, the seven-day average was 53,000 cases a day, said Rochelle Walensky, director of the CDC, during a press briefing Monday.

The U.S. is in a “complicated stage” of the pandemic, Dr. Walensky said.

“The more people get vaccinated, the fewer infections there will be, which means fewer variants will emerge and fewer breakthrough infections will occur and the quicker we can get back to doing the things we love,” said Dr. Walensky.

More than a quarter of the U.S. population has now been fully vaccinated against Covid-19, according to CDC data. The country administered an average of 3.2 million doses a day over the past week, according to a Wall Street Journal analysis of CDC data.

As of Monday, all American adults are eligible to receive a Covid-19 vaccine, with every state meeting the April 19 deadline set by President Biden.

Author(s): Melanie Grayce West

Publication Date: 19 April 2021

Publication Site: Wall Street Journal

J&J Covid-19 Vaccine Pause Driven by Risk of Mistreating Blood Clots

Link: https://www.wsj.com/articles/j-j-covid-19-vaccine-was-paused-over-blood-clot-treatment-concerns-11618777554

Excerpt:

U.S. health authorities came close to simply warning about a blood-clotting risk from Johnson & Johnson’s Covid-19 vaccine, but they decided to recommend pausing use out of concern doctors would improperly treat the condition, people familiar with the matter said.

Over the previous four weeks, U.S. health officials had become alarmed about similar blood-clotting conditions in Europe involving a Covid-19 vaccine from AstraZeneca PLC, the people said. The officials dug into a U.S. vaccine safety database and identified the cases of great concern, but they debated what action to take.

By the night of April 12, the officials resolved that urgent action was needed, the people said. Four of six women in the U.S. who developed the clots days after vaccination had initially been given blood thinner heparin, according to the federal Centers for Disease Control and Prevention. Its use could have worsened the patients’ condition, the people said.

Author(s): Thomas M. Burton and Betsy McKay

Publication Date: 18 April 2021

Publication Site: Wall Street Journal

U.S. Calls for Pause on Johnson & Johnson Vaccine After Clotting Cases

Link: https://www.nytimes.com/2021/04/13/us/politics/johnson-johnson-vaccine-blood-clots-fda-cdc.html

Excerpt:

Federal health agencies on Tuesday called for an immediate pause in use of Johnson & Johnson’s single-dose coronavirus vaccine after six recipients in the United States developed a rare disorder involving blood clots within about two weeks of vaccination.

All six recipients were women between the ages of 18 and 48. One woman died and a second woman in Nebraska has been hospitalized in critical condition.

Nearly seven million people in the United States have received Johnson & Johnson shots so far, and roughly nine million more doses have been shipped out to the states, according to data from the Centers for Disease Control and Prevention.

Author(s): Noah Weiland, Sharon LaFraniere, Carl Zimmer

Publication Date: 13 April 2021

Publication Site: New York Times

Mortality with Meep: Top Causes of Death in the United States in 2020

Link: https://marypatcampbell.substack.com/p/mortality-with-meep-top-causes-of

Graphic:

Excerpt:

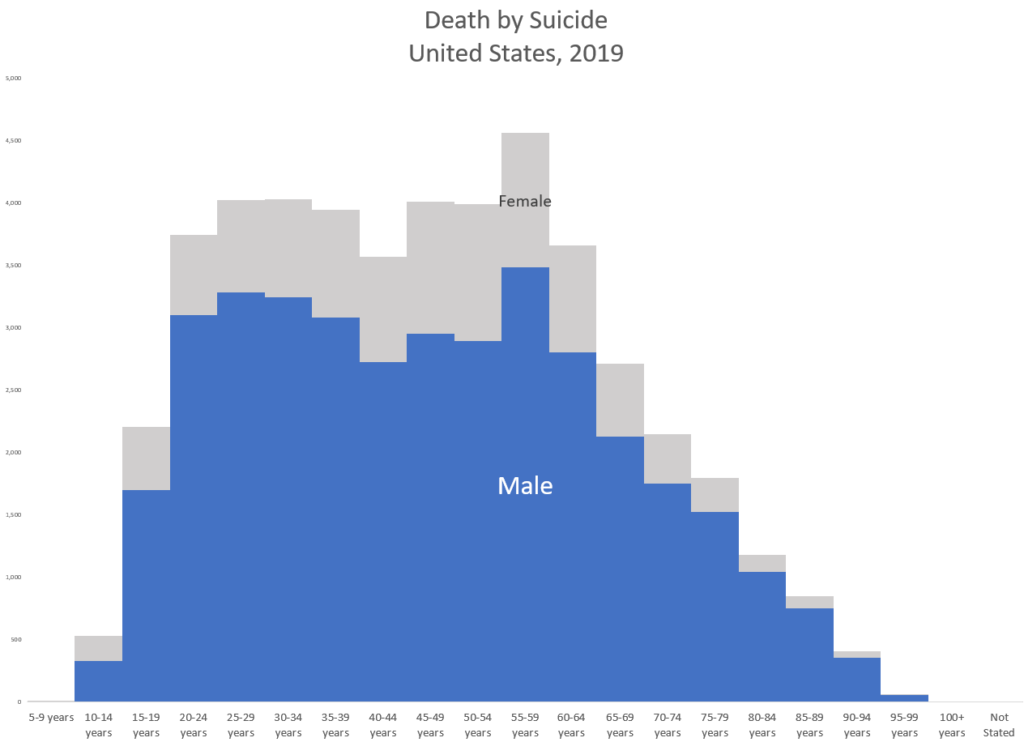
You’ll see that among adults, the age range with the most suicides are people age 50-55. That’s due to two things: the number of people in that age range (early Gen X, so tailing off from Boomers) and the rate. For each age group far more males die by suicide than do females.

You can see that deaths by suicide in number drop off in old age…. but that’s because the population is dropping off in size (as mortality rates accelerate at high ages).

Author(s): Mary Pat Campbell

Publication Date: 12 April 2021

Publication Site: STUMP at substack

Excess Deaths From COVID-19 and Other Causes in the US, March 1, 2020, to January 2, 2021

Link: https://jamanetwork.com/journals/jama/fullarticle/2778361

Graphic:

Excerpt:

Between March 1, 2020, and January 2, 2021, the US experienced 2 801 439 deaths, 22.9% more than expected, representing 522 368 excess deaths (Table). The excess death rate was higher among non-Hispanic Black (208.4 deaths per 100 000) than non-Hispanic White or Hispanic populations (157.0 and 139.8 deaths per 100 000, respectively); these groups accounted for 16.9%, 61.1%, and 16.7% of excess deaths, respectively. The US experienced 4 surge patterns: in New England and the Northeast, excess deaths surged in the spring; in the Southeast and Southwest, in the summer and early winter; in the Plains, Rocky Mountain, and far West, primarily in early winter; and in the Great Lakes, bimodally, in the spring and early winter (Figure). Excess deaths were increasing in all regions at the end of 2020. The 10 states with the highest per capita rate of excess deaths were Mississippi, New Jersey, New York, Arizona, Alabama, Louisiana, South Dakota, New Mexico, North Dakota, and Ohio. New York experienced the largest relative increase in all-cause mortality (38.1%). Deaths attributed to COVID-19 accounted for 72.4% of US excess deaths.

Joinpoint analyses revealed an increase in weekly mortality from non–COVID-19 causes, including heart disease from March 15 to April 11, 2020 (APC, 4.9 [95% CI, 0.7-9.3]), and October 11, 2020, to January 2, 2021 (APC, 1.1 [95% CI, 0.8-1.4]); Alzheimer disease/dementia from March 15 to April 11, 2020 (APC, 7.1 [95% CI, 2.4-12.0]), May 31 to August 15, 2020 (APC, 1.2 [95% CI, 0.7-1.6]), and September 6, 2020, to January 2, 2021 (APC, 1.3 [95% CI, 1.1-1.5]); and diabetes from March 8 to April 11, 2020 (APC, 6.5 [95% CI, 2.8-10.3]), May 31 to July 11, 2020 (APC, 2.6 [95% CI, 0.2-5.0]), and October 18, 2020, to January 2, 2021 (APC, 2.2 [95% CI, 1.6-2.8]).

Author(s): Steven H. Woolf, MD, MPH1Derek A. Chapman, PhD1Roy T. Sabo, PhD2et al

Publication Date: 2 April 2021

Publication Site: JAMA

Provisional Mortality Data — United States, 2020

Link: https://www.cdc.gov/mmwr/volumes/70/wr/mm7014e1.htm

Graphic:

Excerpt:

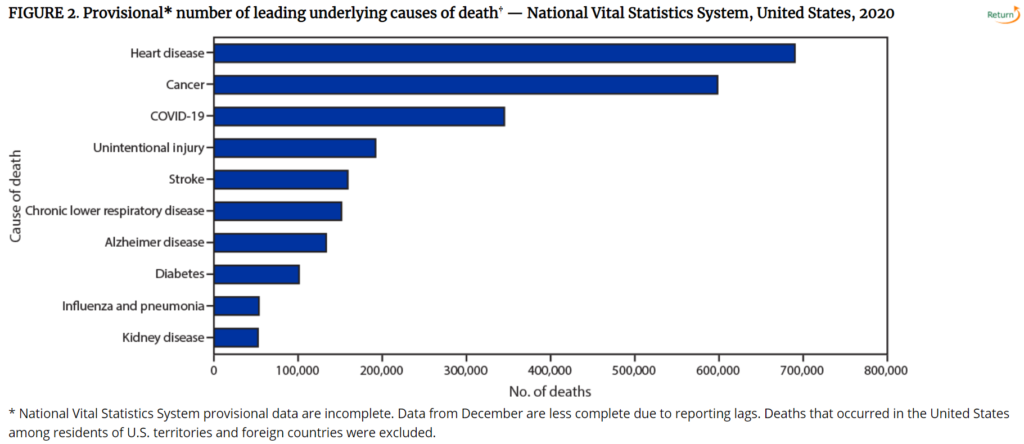
During January–December 2020, the estimated 2020 age-adjusted death rate increased for the first time since 2017, with an increase of 15.9% compared with 2019, from 715.2 to 828.7 deaths per 100,000 population. COVID-19 was the underlying or a contributing cause of 377,883 deaths (91.5 deaths per 100,000). COVID-19 death rates were highest among males, older adults, and AI/AN and Hispanic persons. The highest numbers of overall deaths and COVID-19 deaths occurred during April and December. COVID-19 was the third leading underlying cause of death in 2020, replacing suicide as one of the top 10 leading causes of death (6).

The findings in this report are subject to at least four limitations. First, data are provisional, and numbers and rates might change as additional information is received. Second, timeliness of death certificate submission can vary by jurisdiction. As a result, the national distribution of deaths might be affected by the distribution of deaths from jurisdictions reporting later, which might differ from those in the United States overall. Third, certain categories of race (i.e., AI/AN and Asian) and Hispanic ethnicity reported on death certificates might have been misclassified (7), possibly resulting in underestimates of death rates for some groups. Finally, the cause of death for certain persons might have been misclassified. Limited availability of testing for SARS-CoV-2, the virus that causes COVID-19, at the beginning of the COVID-19 pandemic might have resulted in an underestimation of COVID-19–associated deaths.

This report provides an overview of provisional U.S. mortality data for 2020. Provisional death estimates can give researchers and policymakers an early indication of shifts in mortality trends and provide actionable information sooner than the final mortality data that are released approximately 11 months after the end of the data year. These data can guide public health policies and interventions aimed at reducing numbers of deaths that are directly or indirectly associated with the COVID-19 pandemic and among persons most affected, including those who are older, male, or from disproportionately affected racial/ethnic minority groups.

Author(s): Farida B. Ahmad, Jodi A. Cisewski, Arialdi Miniño, Robert N. Anderson

Publication Date: 31 March 2021

Publication Site: CDC

Mortality with Meep: Ranking the States (and NYC and DC) by Excess Mortality

Link: https://marypatcampbell.substack.com/p/mortality-with-meep-ranking-the-states

Graphic:

Excerpt:

The three worst areas just pop out: Arizona, New Jersey, and New York City.

(Also popping out: the hole where North Carolina should be. I’m going to guess it has landed in the midrange of states, like its neighbors South Carolina and Tennessee.)

New York state excluding NYC (which is what the NY square represents) is middle-of-the-pack for excess mortality, which is hardly surprising – as most of New Jersey is crowded near NYC, New York state is geographically huge and has significant populations on the Great Lakes, far away from NYC.

The lowest excess mortality also really pops out: some states bordering on the edges of Canada, plus Hawaii. It is a little surprising that Washington State, in particular, has not been hit hard by COVID mortality.

Author(s): Mary Pat Campbell

Publication Date: 1 April 2021

Publication Site: STUMP at substack