Achievements in Public Health, 1900-1999: Healthier Mothers and Babies

Link: https://www.cdc.gov/mmwr/preview/mmwrhtml/mm4838a2.htm

Graphic:

Excerpt:

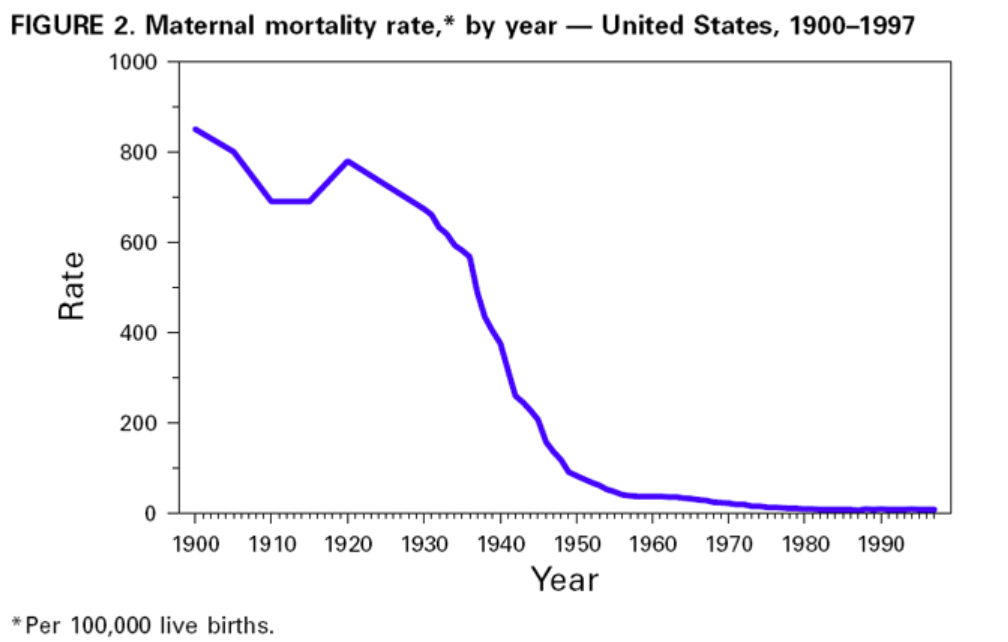
Despite the dramatic decline in infant and maternal mortality during the 20th century, challenges remain. Perhaps the greatest is the persistent difference in maternal and infant health among various racial/ethnic groups, particularly between black and white women and infants. Although overall rates have plummeted, black infants are more than twice as likely to die as white infants; this ratio has increased in recent decades. The higher risk for infant mortality among blacks compared with whites is attributed to higher LBW incidence and preterm births and to a higher risk for death among normal birthweight infants (greater than or equal to 5 lbs, 8 oz [greater than or equal to 2500 g]) (18). American Indian/ Alaska Native infants have higher death rates than white infants because of higher SIDS rates. Hispanics of Puerto Rican origin have higher death rates than white infants because of higher LBW rates (19). The gap in maternal mortality between black and white women has increased since the early 1900s. During the first decades of the 20th century, black women were twice as likely to die of pregnancy-related complications as white women. Today, black women are more than three times as likely to die as white women.

During the last few decades, the key reason for the decline in neonatal mortality has been the improved rates of survival among LBW babies, not the reduction in the incidence of LBW. The long-term effects of LBW include neurologic disorders, learning disabilities, and delayed development (20). During the 1990s, the increased use of assisted reproductive technology has led to an increase in multiple gestations and a concomitant increase in the preterm delivery and LBW rates (21). Therefore, in the coming decades, public health programs will need to address the two leading causes of infant mortality: deaths related to LBW and preterm births and congenital anomalies. Additional substantial decline in neonatal mortality will require effective strategies to reduce LBW and preterm births. This will be especially important in reducing racial/ethnic disparities in the health of infants.

Approximately half of all pregnancies in the United States are unintended, including approximately three quarters among women aged less than 20 years. Unintended pregnancy is associated with increased morbidity and mortality for the mother and infant. Lifestyle factors (e.g., smoking, drinking alcohol, unsafe sex practices, and poor nutrition) and inadequate intake of foods containing folic acid pose serious health hazards to the mother and fetus and are more common among women with unintended pregnancies. In addition, one fifth of all pregnant women and approximately half of women with unintended pregnancies do not start prenatal care during the first trimester. Effective strategies to reduce unintended pregnancy, to eliminate exposure to unhealthy lifestyle factors, and to ensure that all women begin prenatal care early are important challenges for the next century.

Author(s): Division of Reproductive Health, National Center for Chronic Disease Prevention and Health Promotion, CDC.

Publication Date: 1 October 1999

Publication Site: CDC MMWR

Year 2000 Standard Million Population for the United States — Age-Adjusted Rates

Link: https://wonder.cdc.gov/wonder/help/ucd.html#Age-Adjusted%20Rates

Graphic:

Excerpt:

Age-Adjusted Rates

Age-adjusted death rates are weighted averages of the age-specific death rates, where the weights represent a fixed population by age. They are used to compare relative mortality risk among groups and over time. An age-adjusted rate represents the rate that would have existed had the age-specific rates of the particular year prevailed in a population whose age distribution was the same as that of the fixed population. Age-adjusted rates should be viewed as relative indexes rather than as direct or actual measures of mortality risk.

The year “2000 U.S. standard” is the default population selection for the calculation of age-adjusted rates. However, you can select other standard populations, or select specific population criteria to determine the age distribution ratios. See Frequently Asked Questions about Death Rates for more information.

The rates of almost all causes of death vary by age. Age adjustment is a technique for “removing” the effects of age from crude rates, so as to allow meaningful comparisons across populations with different underlying age structures. For example, comparing the crude rate of heart disease in Florida to that of California is misleading, because the relatively older population in Florida will lead to a higher crude death rate, even if the age-specific rates of heart disease in Florida and California are the same. For such a comparison, age-adjusted rates are preferable. Age-adjusted rates should be viewed as relative indexes rather than as direct or actual measures of mortality risk.

The National Center for Health Statistics (NCHS) age-adjusts death rates using the direct method. That is, by applying age-specific death rates (Ri) to the U.S. standard population age distribution.

R’ = S i ( Psi / Ps ) R i

where Psi is the standard population for age group i and Ps is the total U.S. standard population (all ages combined).

In the direct method, a standard age distribution is chosen and the age-specific death rates are weighted according to the standard. A reasonable choice for the standard is the U.S. total population (all races, both genders) for the year under study. To permit comparison of death rates from year to year, a standard population is used. Beginning with the 1999 data year, NCHS adopted the year 2000 projected population of the United States as the standard population. This new standard replaces the 1940 standard population that was used by NCHS for over 50 years. The new population standard affects the level of mortality and to some extent trends and group comparisons. Of particular note are the effects on race comparison of mortality. For detailed discussion, see:Anderson RN, Rosenberg HM. Age standardization of death rates: Implementation of the year 2000 standard. National Vital Statistics Reports; vol 47 no 3. Hyattsville, Maryland. National Center for Health Statistics. 1998.Beginning with publications of the year 2003 data, the traditional standard million population along with corresponding standard weights to six decimal places were replaced by the projected year 2000 population age distribution (see 2000 Standard Population below). The effect of the change is negligible and does not significantly affect comparability with age-adjusted rates calculated using the previous method.

Publication Date: Accessed 21 May 2022, last reviewed 2 March 2022

Publication Site: CDC WONDER

US overdose deaths hit record 107,000 last year, CDC says

Link: https://www.fox10tv.com/2022/05/11/us-overdose-deaths-hit-record-107000-last-year-cdc-says/

Excerpt:

More than 107,000 Americans died of drug overdoses last year, setting another tragic record in the nation’s escalating overdose epidemic, the Centers for Disease Control and Prevention estimated Wednesday.

The provisional 2021 total translates to roughly one U.S. overdose death every 5 minutes. It marked a 15% increase from the previous record, set the year before. The CDC reviews death certificates and then makes an estimate to account for delayed and incomplete reporting.

Dr. Nora Volkow, director of the National Institute on Drug Abuse, called the latest numbers “truly staggering.”

The White House issued a statement calling the accelerating pace of overdose deaths “unacceptable” and promoting its recently announced national drug control strategy. It calls for measures like connecting more people to treatment, disrupting drug trafficking and expanding access to the overdose-reversing medication naloxone.

U.S. overdose deaths have risen most years for more than two decades. The increase began in the 1990s with overdoses involving opioid painkillers, followed by waves of deaths led by other opioids like heroin and — most recently — illicit fentanyl.

Author(s): Mike Stobbe, Associated Press

Publication Date: 11 May 2022

Publication Site: Fox 10 TV

If you’re vaxxed, you’re more likely to be killed by lightning than die of COVID: study

Link:https://nypost.com/2022/02/08/lightnings-more-likely-good-odds-for-vaxxed/

Graphic:

Excerpt:

Those odds can be gauged from a study by researchers at the National Institutes of Health, published by the Centers for Disease Control and Prevention. They tracked more than 1 million vaccinated adults in America over most of last year, including the period when the Delta variant was surging, and classified victims of COVID according to risk factors such as being over 65, being immunosuppressed or suffering from diabetes or chronic diseases of the heart, kidney, lungs, liver or brain.

The researchers report that none of the healthy people under 65 had a severe case of COVID that required treatment in an intensive-care unit.

 Not a single one of these nearly 700,000 people died, and the risk was minuscule for most older people, too. Among vaccinated people over 65 without an underlying medical condition, only one person died.

In all, there were 36 deaths, mostly among a small minority of older people with a multitude of comorbidities: the 3% of the sample that had at least four risk factors.

Author(s): John Tierney

Publication Date: 8 Feb 2022

Publication Site: NY Post

Covid-19 Pandemic Led to Smaller-Than-Expected Baby Bust, New Data Suggest

Link:https://www.wsj.com/articles/covid-19-pandemic-led-to-smaller-than-expected-baby-bust-new-data-suggest-11644328800

Graphic:

Excerpt:

New data on U.S. births suggest that the Covid-19 pandemic has led to a smaller-than-expected baby bust.

The U.S. saw about 7,000 fewer births through the first nine months of 2021 compared with the same period the year prior, according to provisional data from the Centers for Disease Control and Prevention’s National Center for Health Statistics. The numbers reflect conceptions that occurred roughly from April through December 2020, a period that includes the first part of last winter’s Covid-19 case surge, which started in October 2020 and waned by February 2021.

Author(s): Janet Adamy and Anthony DeBarros

Publication Date: 8 Feb 2022

Publication Site: WSJ

Supplements: COVID-19; Racial and Ethnic Disparities: Chapter 13

Link:https://adr.usrds.org/2021/supplements-covid-19-disparities/13-covid-19-supplement

Graphic:

Excerpt:

Among beneficiaries with CKD, mortality during COVID-19 hospitalization was approximately 40% during the first wave of the pandemic but decreased thereafter, reaching an average of 18% from July to December (Figure 13.10).

During all of 2020, the incidence of in-hospital death during COVID-19 hospitalizations was 21.5% among older Medicare beneficiaries with CKD, 18.8% among beneficiaries undergoing dialysis, and 19.3% among beneficiaries with a kidney transplant.

Between epidemiologic week 13 of 2020 and epidemiologic week 8 of 2021, the number of prevalent dialysis patients fell from 567,303 to 555,264, an unprecedented decline of over 2% (Figure 13.11).

Among patients undergoing dialysis, mortality was consistently elevated, relative to recent historical norms, between epidemiologic week 12 of 2020 and week 10 of 2021. Among patients with a kidney transplant, excess mortality was persistent through the second quarter of 2021 (Figure 13.12a).

The cumulative number of deaths among dialysis patients in 2020 was 18% higher than in 2019, while the cumulative number of deaths among transplant patients in 2020 was 41% higher than in 2019 (Figure 13.12b).

Publication Date: accessed 9 Feb 2022

Publication Site: U.S. Renal Data System

COVID Waves in 2020 Caused Bigger U.S Death Rate Spike Than 1918 Flu: Actuaries

Link:https://www.thinkadvisor.com/2022/01/26/covid-waves-in-2020-caused-bigger-u-s-death-rate-spike-than-1918-flu-actuaries/

Excerpt:

The pandemic led to the biggest U.S. death rate increase from causes other than COVID-19 since 1936.

The death rate in the highest-income counties increased to 736.1 deaths per 100,000 people, from 638.4 per 100,000 in 2019

For people ages 5 through 44, increases in the death rate from causes other than COVID-19 were much bigger than the increase caused directly by COVID-19.

Author(s): Allison Bell

Publication Date: 26 Jan 2021

Publication Site: Think Advisor

Provisional Drug Overdose Death Counts

Link:https://www.cdc.gov/nchs/nvss/vsrr/drug-overdose-data.htm

Graphic:

Excerpt:

This data visualization presents provisional counts for drug overdose deaths based on a current flow of mortality data in the National Vital Statistics System. Counts for the most recent final annual data are provided for comparison. National provisional counts include deaths occurring within the 50 states and the District of Columbia as of the date specified and may not include all deaths that occurred during a given time period. Provisional counts are often incomplete and causes of death may be pending investigation (see Technical notes) resulting in an underestimate relative to final counts. To address this, methods were developed to adjust provisional counts for reporting delays by generating a set of predicted provisional counts (see Technical notes).

Author(s): Ahmad FB, Rossen LM, Sutton P

Publication Date: accessed 5 Feb 2022

Publication Site: CDC

More than 1 million have died in the overdose crisis, but still the response is scandalously inadequate

Link:https://www.washingtonpost.com/opinions/2022/01/24/dopesick-author-on-opioid-crisis/

Excerpt:

These are measures taken by people desperately fighting, largely on their own, against a drug-overdose death toll that historically has killed more Americans than the coronavirus pandemic. Since 1996, the year OxyContin launched and the United States’ health-care system fell prey to the lie that opioid painkillers were safe for virtually everything from headaches to wisdom-tooth surgery, more than 1 million Americans have died of overdoses; the coronavirus pandemic has claimed about 850,000. During the first year of the pandemic, the Centers for Disease Control and Prevention reported a record 100,000 annual overdose deaths.

….

But with an even more lethal overdose crisis — and that’s not counting all the addiction-related deaths from hepatitis, endocarditis and suicide — the nation’s leadership appears capable of only minor tweaks.

Some blue-leaning states and cities now offer evidence-backed practices such as supplying drug users with clean needles and fentanyl test strips, and even offering medically supervised spaces to inject illicit drugs — all of which foster important connections to professional care and wraparound services. But in much of the world’s richest nation, where a few million Americans suffer with opioid use disorder, these measures remain anathema.

The pandemic-prompted loosening of federal regulations for the telehealth prescribing of buprenorphine, the lifesaving addiction medication, has been a bright spot, particularly for rural people who have long struggled with transportation issues. But that policy change remains temporary and the treatment gap (with an estimated 10 to 12 percent of addicted people receiving treatment in an average year) has barely budged.

….

Epidemiologists predict that by 2029, U.S. overdose deaths will have doubled to nearly 2 million. Until we stop arresting and abandoning people who use drugs and start meeting them where they are with treatment and compassion, rare will be the family that remains untouched.

Author(s): Beth Macy

Publication Date: 24 Jan 2022

Publication Site: Washington Post

2021 U.S. January-June Cause-of-Death Ranking Table

Link:https://marypatcampbell.substack.com/p/2021-us-january-june-cause-of-death

Graphic:

Excerpt:

I don’t recommend simply doubling the numbers from the ranking table and comparing them to the 2020 table, especially for the COVID numbers. I know that won’t work, because of the overall 2021 mortality trend we saw:

….

However, I have been making estimates and projections, and I see some really worrying numbers for the ages 15-44 grouping, especially for external causes of death: suicide, homicide, and accidents. The worrying trend is that these may extend past the time COVID mortality wanes. It looks worse for 2021 than for 2020.

I will be doing posts looking at these three large categories, starting with suicide, in upcoming posts, by more detailed demographics than just age. Some of these trends have geographic components to consider as well.

Author(s): Mary Pat Campbell

Publication Date: 27 Jan 2022

Publication Site: STUMP at substack

Mortality Nuggets: Videos on Death Numbers, Ranking Table for States’ Mortality for 2020

Link:https://marypatcampbell.substack.com/p/mortality-nuggets-videos-on-death

Video:

Graphic:

Excerpt:

The ranking tables do reflect where COVID hit hard in 2020 — the spring 2020 wave in the northeast, and the summer 2020 wave along the south and southwest (Texas, in particular). No, Florida didn’t show its big COVID impact until January 2021, so it’s pretty far down on this ranking table.

This way, we can see if there are any geographic patterns. We did know the hot spots of NY, NJ, IL (mainly around Chicago), DC, TX, Louisiana (around New Orleans), Arizona. I had not been aware of Mississippi being so bad, but maybe that was spillover from New Orleans.

Author(s): Mary Pat Campbell

Publication Date: 15 Jan 2022

Publication Site: STUMP at substack

Top Causes of Death by Age Group, 2020: Raw Numbers

Link: https://marypatcampbell.substack.com/p/top-causes-of-death-by-age-group

Graphic:

Excerpt:

The numbers below each cause are the total number of finalized deaths in CDC Wonder as of 11 January 2022 for the completed calendar year 2020.

COVID deaths for under age 15 weren’t in the top 10 causes for those age groups, which is why they aren’t seen in the table. But you may be interested in those numbers:
at #12 for ages 5-14, with 49 deaths
at #12 for ages 1-4, with 19 deaths
at #13 for infant mortality (<1 year), at 35 deaths

In general, other than the new cause of COVID, most of the causes of death were in the same rank order as in 2019, with a few switches for causes that tend to be close in numbers.

Author(s): Mary Pat Campbell

Publication Date: 12 Jan 2022

Publication Site: STUMP at substack