As U.S. Nears 800,000 Virus Deaths, 1 of Every 100 Older Americans Has Perished

Link: https://www.nytimes.com/2021/12/13/us/covid-deaths-elderly-americans.html

Graphic:

Excerpt:

As the coronavirus pandemic approaches the end of a second year, the United States stands on the cusp of surpassing 800,000 deaths from the virus, and no group has suffered more than older Americans. All along, older people have been known to be more vulnerable, but the scale of loss is only now coming into full view.

Seventy-five percent of people who have died of the virus in the United States — or about 600,000 of the nearly 800,000 who have perished so far — have been 65 or older. One in 100 older Americans has died from the virus. For people younger than 65, that ratio is closer to 1 in 1,400.

…..

After the first known coronavirus death in the United States in February 2020, the virus’s death toll in this country reached 100,000 people in only three months. The pace of deaths slowed throughout summer 2020, then quickened throughout the fall and winter, and then slowed again this spring and summer.

Throughout the summer, most people dying from the virus were concentrated in the South. But the most recent 100,000 deaths — beginning in early October — have spread out across the nation, in a broad belt across the middle of the country from Pennsylvania to Texas, the Mountain West and Michigan.

These most recent 100,000 deaths, too, have all occurred in less than 11 weeks, a sign that the pace of deaths is moving more quickly once again — faster than at any time other than last winter’s surge.

By now, Covid-19 has become the third leading cause of death among Americans 65 and older, after heart disease and cancer. It is responsible for about 13 percent of all deaths in that age group since the beginning of 2020, more than diabetes, accidents, Alzheimer’s disease or dementia.

Author(s): Julie Bosman, Amy Harmon and Albert Sun

Publication Date: 13 Dec 2021

Publication Site: New York Times
Thousands more people than usual are dying … but it’s not from Covid

Link:https://www.yahoo.com/news/analysis-thousands-more-usual-dying-170117640.html

:

Excerpt:

While focus remains firmly fixed on Covid-19, a second health crisis is quietly emerging in Britain. Since the beginning of July, there have been thousands of excess deaths that were not caused by coronavirus.

According to health experts, this is highly unusual for the summer. Although excess deaths are expected during the winter months, when cold weather and seasonal infections combine to place pressure on the NHS, summer generally sees a lull.

….

Data from Public Health England (PHE) shows that during that period there were 2,103 extra death registrations with ischemic heart disease, 1,552 with heart failure, as well as an extra 760 deaths with cerebrovascular diseases such as stroke and aneurysm and 3,915 with other circulatory diseases.

Acute and chronic respiratory infections were also up with 3,416 more mentions on death certificates than expected since the start of July, while there have been 1,234 extra urinary system disease deaths, 324 with cirrhosis and liver disease and 1,905 with diabetes.

Alarmingly, many of these conditions saw the biggest drops in diagnosis in 2020, as the NHS struggled to cope with the pandemic.

Author(s): Sarah Knapton

Publication Date: 24 Sept 2021

Publication Site: Yahoo News

Mortality with Meep: Cause of Death Trend — Heart Disease — 1999-2020

Link: https://marypatcampbell.substack.com/p/mortality-with-meep-cause-of-death

Video:

Graphic:

Excerpt:

The long-term trend has been improvement for this cause of death, with it most obvious for the oldest age groups. This trend has been driven by improvement in medical treatment for the condition, but also due to the decrease in smoking rates… decades ago. Some causes of death have behavior that precedes the death by decades, which can get tricky to track for our top two causes of death: heart disease and cancer. Even so, smoking cigarettes has been a huge driver for both these causes, and made a large differentiator by sex and smoking status for a long time.

Author(s): Mary Pat Campbell

Publication Date: 26 July 2021

Publication Site: STUMP at substack

India Has Undercounted Covid-19 Deaths by Hundreds of Thousands, Families and Experts Say

Link: https://www.wsj.com/articles/india-has-undercounted-covid-19-deaths-by-hundreds-of-thousands-families-and-experts-say-11624795202

Graphic:

Excerpt:

India has officially recorded more than 390,000 coronavirus deaths, but families who have lost loved ones, health experts and statisticians say that vastly undercounts the true toll. Families like Mrs. Singh’s have been left struggling to get compensation that some states have set up for Covid-19 victims.

India’s undercount has also left a huge gap in the world’s understanding of the impact of the Delta variant, which health experts believe helped drive one of the world’s worst Covid-19 surges in April and May. India was the first to detect the highly infectious variant, which has hopscotched around the world. It is fueling a surge in the U.K., and is expected to become the dominant variant in the U.S.

The undercounting of infections and deaths is a problem world-wide, even in countries with widespread testing. The World Health Organization said last month that the global Covid-19 death toll could be two or three times the official number. The problem, however, is particularly acute in the developing world, where access to healthcare and coronavirus testing is often more limited.

…..
To qualify for its Covid-19 compensation payment of 400,000 rupees, equivalent to about $5,400, the state requires a report from a certified lab, which at the time were taking days to process.The family got a test strip from the lab indicating that Mrs. Singh was positive and rushed to a doctor.
……
Health experts say many Covid-19 deaths have gone uncounted among India’s vast population of rural poor, who have little access to healthcare or Covid-19 testing.

Mr. Banaji, the mathematician, says the central government has tended to praise states with low death counts and castigate those with higher counts as incompetent. “This narrative of success and failure centered on fatality numbers is very dangerous,” he said.

Author(s): Shan Li, Suryatapa Bhattacharya, Vibhuti Agarwal

Publication Date: 17 June 2021

Publication Site: WSJ

Alameda County Updates COVID-19 Death Calculation to Align with State Definitions

Link: https://covid-19.acgov.org/covid19-assets/docs/press/press-release-2021.06.04.pdf

Excerpt:

Today, June 4, Alameda County’s COVID-19 dashboard will be updated to reflect
the total number of COVID-19 deaths using the State’s death reporting definition. Alameda County previously included any person who died while infected with the virus in the total COVID-19 deaths for the County. Aligning with the State’s definition will require Alameda County to report as COVID-19 deaths only those people who died as a direct result of COVID-19, with COVID-19 as a contributing cause of death, or in whom death caused by COVID-19 could not be ruled out. Based on data available as of May 23, 2021, this update will decrease the overall number of deaths from 1,634 to 1,223.

….

This update does not disproportionally impact reported deaths for any specific race or ethnic group or zip code.

Close observers of Alameda County’s dashboard may have noticed a substantial increase in the COVID-19 death totals prior to this update, during the week of May 17. This increase was due to a separate quality assurance process intended to correct previously incomplete data; adjustments were made based on additional information that became available regarding date of death and county of residence. These corrections are unrelated to the current alignment with the State’s definition of death due to COVID-19, and some of the deaths will be removed from the updated totals because COVID-19 was not a contributing cause.

Author(s): Neetu Balram

Publication Date: 4 June 2021

Publication Site: Alameda County Health Care Services Agency

California county cuts COVID-19 death toll by 25% after finding some deaths ‘clearly not’ caused by virus

Link: https://news.yahoo.com/california-county-cuts-covid-19-151921394.html

Excerpt:

California county cut its COVID-19 death toll by around 25% after determining that some deaths were not a “direct result” of the virus.

Alameda County revised the total number of deaths caused by the coronavirus to 1,223, down from 1,634.

County officials decided to revise the numbers to align with the California Department of Public Health’s guidance on how to classify deaths. The county previously included deaths of anyone infected with the virus, regardless of whether COVID-19 was a direct or contributing cause of death.

Author(s): Peter Aitken

Publication Date: 6 June 2021

Publication Site: Yahoo News

Covid: Peru more than doubles death toll after review

Link: https://www.bbc.com/news/world-latin-america-57307861

Graphic:

Excerpt:

Peru has more than doubled its Covid death toll following a review, making it the country with the world’s highest death rate per capita, according to Johns Hopkins University data.

The official death toll is now more than 180,000, up from 69,342, in a country of about 33 million people.

Prime Minister Violeta Bermudez said the number was increased on the advice of Peruvian and international experts.

This was in line with so-called excess deaths figures.

Publication Date: 1 June 2021

Publication Site: BBC News

U.S. Population Mortality Observations Preview of 2020 Experience

Report Link: https://www.soa.org/globalassets/assets/files/resources/research-report/2021/us-population-observations-preview.pdf

Link: https://www.soa.org/resources/research-reports/2021/us-population-observations-preview/

Graphic:

Excerpt:

The overall age-adjusted mortality rate for 2020 was 828.7 deaths per 100,000 of population. This rate was 15.9% greater than the 2019 overall age-adjusted mortality rate. This high level of mortality has not been experienced in the U.S. since 2003.

If deaths coded as COVID (COVID deaths)3 were excluded, the overall age-adjusted 2020 mortality rate would have been 737.2 per 100,000 or 3.1% higher than the 2019 rate. This increase excluding COVID deaths is also noteworthy because it reverses the two previous calendar years of decreasing mortality; however, some or all of this may be due to the misclassification of CODs as discussed in Section 6.

2020 mortality rates increased in both sexes, with the male rates increasing more than the female rates. The differences in the increases between males and females were about 3% when all causes of death (CODs) are included and about 1% when COVID deaths are excluded.

The slope of the 2020 COVID mortality curve by age group is not as steep as the slope of the non-COVID deaths, indicating that COVID impacts younger ages more evenly across age groups that all other non-COVID CODs combined.

In the review of the 2020 mortality rates by age group, it is interesting to see that the highest percentage increases were in the younger adult ages, not at the very old ages. When COVID deaths were removed, ages 15-44 saw the largest increases in mortality rates.

Author(s): Cynthia MacDonald, FSA, MAAA

Publication Date: 20 May 2021

Publication Site: Society of Actuaries

Mortality Charts by Country and Cause, Karl Pettersson

Link: https://mortchart-en.klpn.se/sexesyrs.html

Graphic:

Excerpt:

The aim of this site is to give comprehensible information about trends for cause-specific mortality in different population. Charts may be viewed or downloaded after choice of population, age group and cause of death group. The measures shown in the charts have been calculated using open data from WHO (2017), but the WHO are not responsible for any content on the site. For some countries where population is not available from WHO (2017) for recent years, estimates from United Nations Department of Economic and Social Affairs, Population Division (2015) is used instead.

There are several other websites with visualizations of mortality trends. One of the most advanced is IHME (2015), which contains data for all countries in the world, and uses complicated algorithms to adjust for uncertainties in the underlying data. On this website, the charts are generated dynamically, and the sites may sometimes be slow. Moreover, the visualizations do not go further back in time than 1980, while WHO (2017) has data available from 1950, for several populations. Whitlock (2012) is a website with a great number of static charts based on WHO (2017). This website is no longer maintained, however, because its creator has died.

Author(s): Karl Pettersson

Date Accessed: 17 May 2021

Publication Site: Mortality Charts

Provisional Mortality Data — United States, 2020

Link: https://www.cdc.gov/mmwr/volumes/70/wr/mm7014e1.htm

Graphic:

Excerpt:

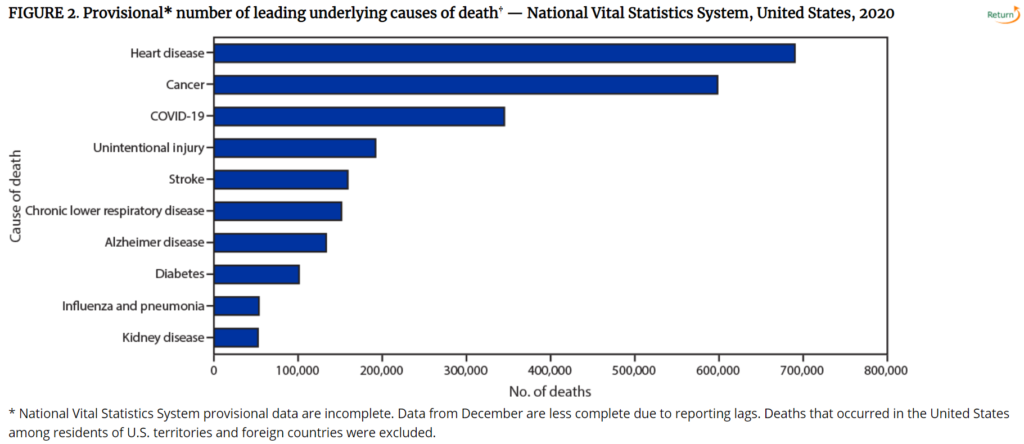
During January–December 2020, the estimated 2020 age-adjusted death rate increased for the first time since 2017, with an increase of 15.9% compared with 2019, from 715.2 to 828.7 deaths per 100,000 population. COVID-19 was the underlying or a contributing cause of 377,883 deaths (91.5 deaths per 100,000). COVID-19 death rates were highest among males, older adults, and AI/AN and Hispanic persons. The highest numbers of overall deaths and COVID-19 deaths occurred during April and December. COVID-19 was the third leading underlying cause of death in 2020, replacing suicide as one of the top 10 leading causes of death (6).

The findings in this report are subject to at least four limitations. First, data are provisional, and numbers and rates might change as additional information is received. Second, timeliness of death certificate submission can vary by jurisdiction. As a result, the national distribution of deaths might be affected by the distribution of deaths from jurisdictions reporting later, which might differ from those in the United States overall. Third, certain categories of race (i.e., AI/AN and Asian) and Hispanic ethnicity reported on death certificates might have been misclassified (7), possibly resulting in underestimates of death rates for some groups. Finally, the cause of death for certain persons might have been misclassified. Limited availability of testing for SARS-CoV-2, the virus that causes COVID-19, at the beginning of the COVID-19 pandemic might have resulted in an underestimation of COVID-19–associated deaths.

This report provides an overview of provisional U.S. mortality data for 2020. Provisional death estimates can give researchers and policymakers an early indication of shifts in mortality trends and provide actionable information sooner than the final mortality data that are released approximately 11 months after the end of the data year. These data can guide public health policies and interventions aimed at reducing numbers of deaths that are directly or indirectly associated with the COVID-19 pandemic and among persons most affected, including those who are older, male, or from disproportionately affected racial/ethnic minority groups.

Author(s): Farida B. Ahmad, Jodi A. Cisewski, Arialdi Miniño, Robert N. Anderson

Publication Date: 31 March 2021

Publication Site: CDC

The Leading Causes of Death in the US for 2020

Link: https://jamanetwork.com/journals/jama/fullarticle/2778234

Graphic:

Excerpt:

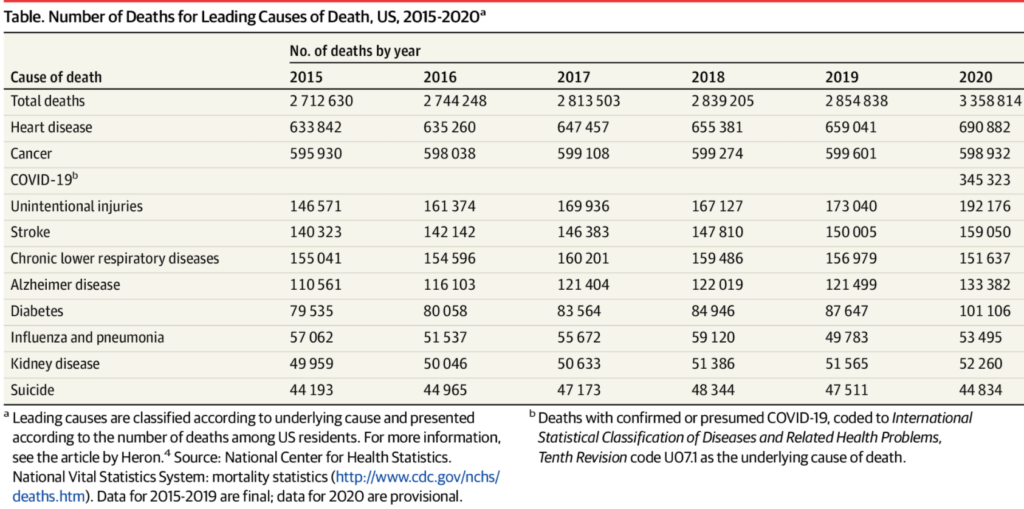
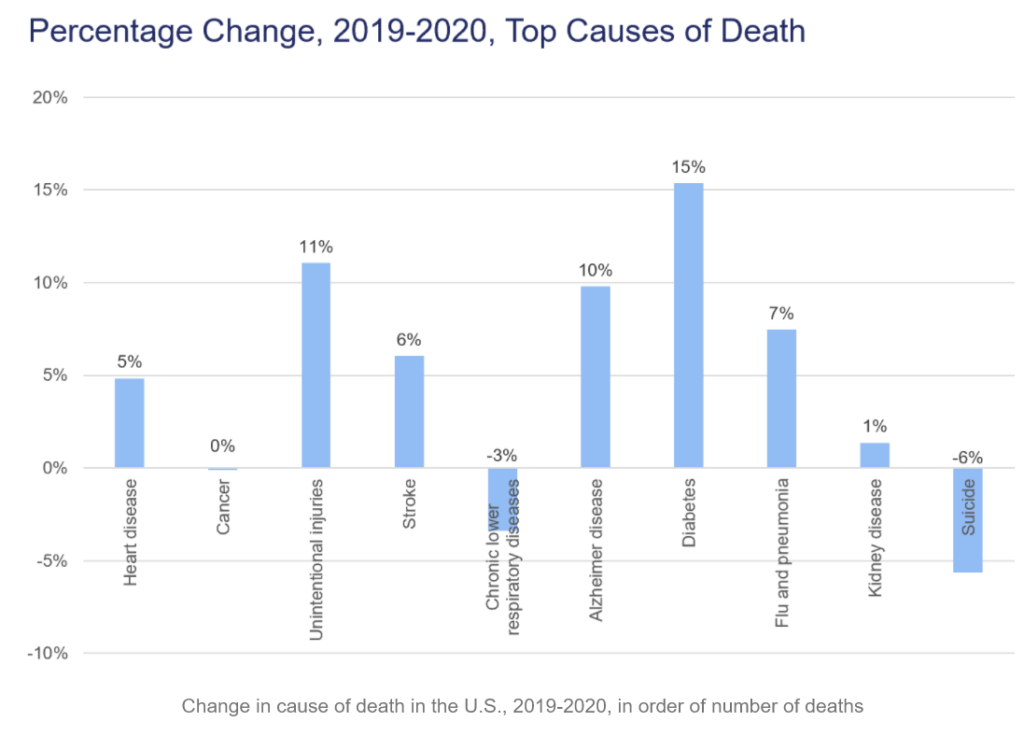
The provisional number of deaths occurring in the US among US residents in 2020 was 3 358 814, an increase of 503 976 (17.7%) from 2 854 838 in 2019 (Table). Historic trends in mortality show seasonality in the number of deaths throughout the year, with the number of deaths higher in the winter and lower in the summer. The eFigure in the Supplement shows that death counts by week from 2015 to 2019 followed a normal seasonal pattern, with higher average death counts in weeks 1 through 10 (n = 58 366) and weeks 35 through 52 (n = 52 892) than in weeks 25 through 34 (n = 50 227). In contrast, increased deaths in 2020 occurred in 3 distinct waves that peaked during weeks 15 (n = 78 917), 30 (n = 64 057), and 52 (n = 80 656), with only the latter wave aligning with historic seasonal patterns.

Author(s): Farida B. Ahmad, Robert N. Anderson

Publication Date: 31 March 2021

Publication Site: JAMA

Temporal dynamics in total excess mortality and COVID-19 deaths in Italian cities

Link: https://bmcpublichealth.biomedcentral.com/articles/10.1186/s12889-020-09335-8

Graphic:

Abstract:

COVID-19 had a greater impact in northern Italian cities among subjects aged 75–84 and 85+ years. COVID-19 deaths accounted for half of total excess mortality in both areas, with differences by age: almost all excess deaths were from COVID-19 among adults, while among the elderly only one third of the excess was coded as COVID-19. When taking into account the mortality deficit in the pre-pandemic period, different trends were observed by area: all excess mortality during COVID-19 was explained by deficit mortality in the centre and south, while only a 16% overlap was estimated in northern cities, with quotas decreasing by age, from 67% in the 15–64 years old to 1% only among subjects 85+ years old.

Author(s): Paola Michelozzi, Francesca de’Donato, Matteo Scortichini, Patrizio Pezzotti, Massimo Stafoggia, Manuela De Sario, Giuseppe Costa, Fiammetta Noccioli, Flavia Riccardo, Antonino Bella, Moreno Demaria, Pasqualino Rossi, Silvio Brusaferro, Giovanni Rezza & Marina Davoli

Publication Date: 27 August 2020

Publication Site: BMC Public Health