Her pleas for help were shrugged off, she said, and she was repeatedly sent home from the hospital. Doctors and nurses told her she was suffering from normal contractions, she said, even as her abdominal pain worsened and she began to vomit bile. Angelica said she wasn’t taken seriously until a searing pain rocketed throughout her body and her baby’s heart rate plummeted.
Rushed into the operating room for an emergency cesarean section, months before her due date, she nearly died of an undiagnosed case of sepsis.
Even more disheartening: Angelica worked at the University of Alabama at Birmingham, the university affiliated with the hospital that treated her.
Her experience is a reflection of the medical racism, bias and inattentive care that Black Americans endure. Black women have the highest maternal mortality rate in the United States — 69.9 per 100,000 live births for 2021, almost three times the rate for white women, according to the Centers for Disease Control and Prevention.
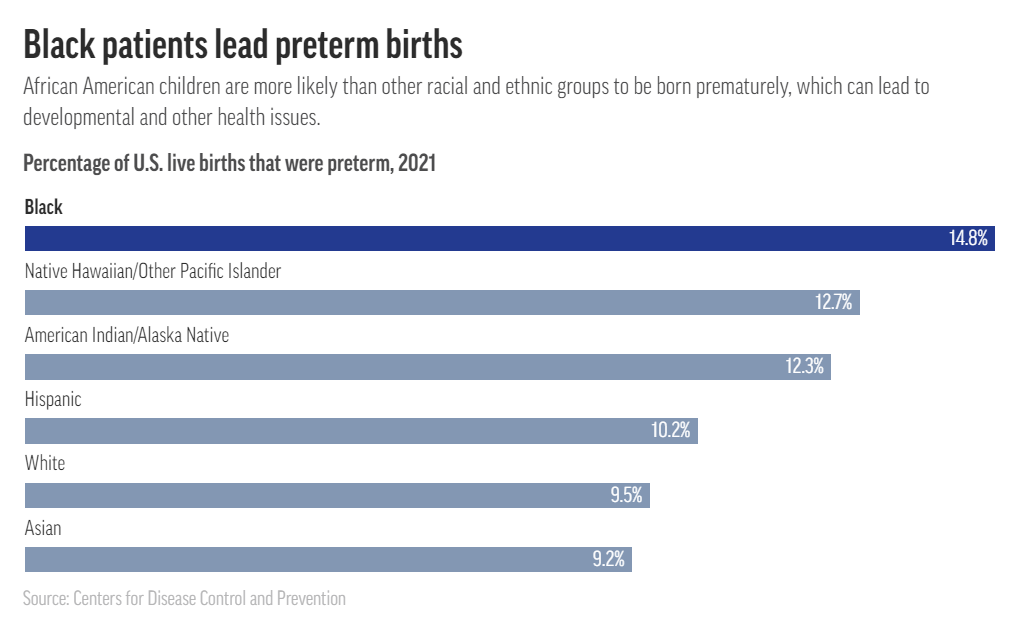
Black babies are more likely to die, and also far more likely to be born prematurely, setting the stage for health issues that could follow them through their lives.
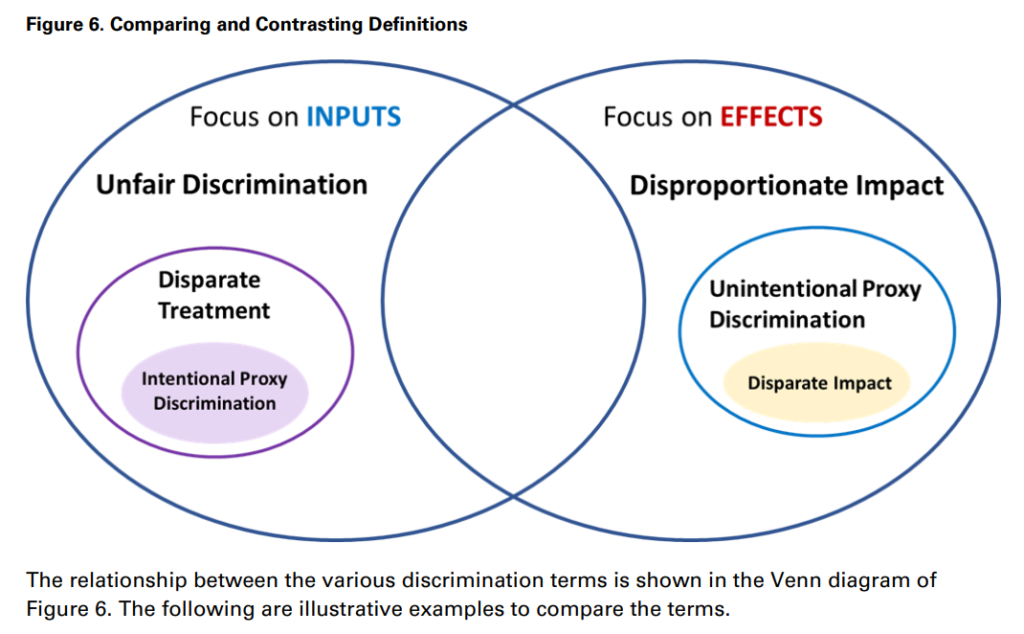
Unfair Discrimination without Disproportionate Impact. As previously defined, unfair discrimination occurs when rating variables that have no relationship to expected loss are used. A hypothetical example could be if an insurer decided to use rating factors that charged those with red cars higher rates, even if the data did not show this. In this case, there would be no disproportionate impact, assuming protected classes do not own a large majority of red cars. Disparate Treatment. Disparate treatment and unfair discrimination are not directly related if we use the Fair Trade Act definition of unfair discrimination. However, in states where rating on protected class is defined to be unfair discrimination, disparate treatment would be a subset of unfair discrimination. In such cases, an insurer would explicitly use protected class to charge higher rates, with the intention of prejudicing against that class. Intentional Proxy Discrimination. If proxy discrimination is defined to require intent, it would be a subset of disparate treatment, whereby an insurer would deliberately substitute a facially neutral variable for protected class for the purpose of discrimination. Redlining is an example of this type of discrimination, given the use of location characteristics as proxies for race and social class. Disproportionate Impact. Disproportionate impact focuses on effect on protected class, even if there is a relationship to expected loss. An example of this is the one mentioned in the AAA study, whereby a rating plan that uses age could disproportionately impact a minority group if those in that minority group tend to have higher risk ages. This disproportionate impact is not necessarily the same as proxy discrimination, since it is likely that even after controlling for minority status, age would have a relationship to expected costs.
Unintentional Proxy Discrimination. If proxy discrimination is defined to be unintentional, the focus is more on disproportionate outcomes and the variables used to substitute for protected class. Several variables are being investigated by regulators to potentially be proxy discrimination and include criminal history for auto insurance rating. In order to prove proxy discrimination, an analysis would have to be performed to understand the extent to which criminal history proxies for minority status, and whether its predictive power would decrease when controlling for protected class. It is important to note once again that terms like “unintentional proxy discrimination” may be subsumed by “disparate impact,” but they are included in this paper to show how various stakeholders use the term differently. Disparate Impact. Disparate impact is unintentional discrimination, where there is disproportionate impact, but also other legal requirements, such as the existence of alternatives. To date, no disparate impact lawsuits against insurance companies have been won. An example of potential disparate impact (although it was not litigated as a lawsuit) is from health care. Optum used an algorithm to identify and allocate additional care to patients with complex healthcare needs. The algorithm was designed to create a risk score for each patient during the enrollment period. Patients above the 97th percentile were automatically enrolled in the program and thus allocated additional care. Upon an independent peer review of the model, researchers found that the model was in fact allocating artificially lower scores to Black patients, even though the model did not use race. The reason behind this was the model’s use of prior healthcare costs as an input. Black patients typically spend less than white patients on health care, which artificially allocated better health to Black patients.18 Unfair Discrimination and Disproportionate Impact. In this case, an insurer would use a variable that both has no relationship to expected loss, but also has an outsized effect on protected classes. An example of this could be the same red car case above, but where protected classes also owned almost all the red cars. In this case, higher rates would create a disproportionate effect on protected classes, while also having no relationship to expected loss.
Narrow or prejudiced thinking is simple to write down and easy to copy and paste over and over. Descriptions such as “difficult” and “disruptive” can become hard to escape. Once so labeled, patients can experience “downstream effects,” said Dr. Hardeep Singh, an expert in misdiagnosis who works at the Michael E. DeBakey Veterans Affairs Medical Center in Houston. He estimates misdiagnosis affects 12 million patients a year.
Conveying bias can be as simple as a pair of quotation marks. One team of researchers found that Black patients, in particular, were quoted in their records more frequently than other patients when physicians were characterizing their symptoms or health issues. The quotation mark patterns detected by researchers could be a sign of disrespect, used to communicate irony or sarcasm to future clinical readers. Among the types of phrases the researchers spotlighted were colloquial language or statements made in Black or ethnic slang.
“Black patients may be subject to systematic bias in physicians’ perceptions of their credibility,” the authors of the paper wrote.
That’s just one study in an incoming tide focused on the variations in the language that clinicians use to describe patients of different races and genders. In many ways, the research is just catching up to what patients and doctors knew already, that discrimination can be conveyed and furthered by partial accounts.
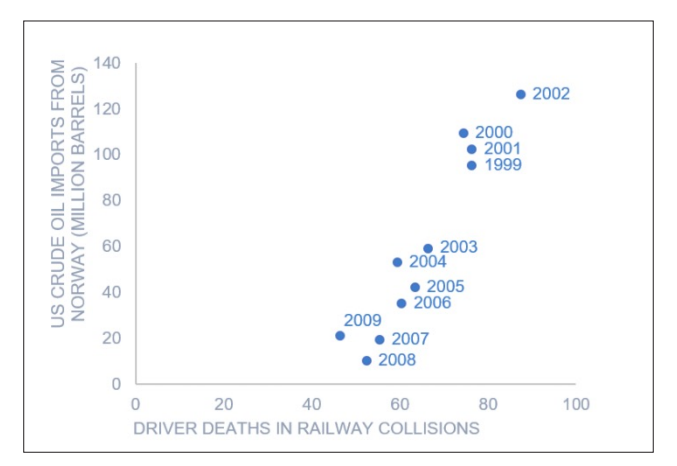
Examine the quality of the theory behind the correlated variables. Is there good reason to believe, as validated by research, the variables would occur together? If such validation does not exist, then the relationship may be spurious. For example, is there any validation to the relationship between the number of driver deaths in railway collisions by year (the horizontal axis), and the annual imports of Norwegian crude oil by the U.S., as depicted below?36 This is an example of a spurious correlation. It is not clear what a rational explanation would be for this relationship.
Systemic Influences and Socioeconomics ❑ Checking for and removing of systemic biases is difficult. ❑ Systemic biases can creep in at every step of the modeling process: data, algorithms, and validation of results. ❑ Human involvement in designing and coding algorithms, where there is a lack of diversity among coders ❑ Biases embedded in training datasets ❑ Use of variables that proxy for membership in a protected class ❑ Statistical discrimination profiling shopping behavior, such as price optimization ❑ Technology-facilitated advertising algorithms used in ad targeting and ad delivery
Author(s): David Sandberg, Data Science and Analytics Committee, AAA
For anti-racist dataviz, our most effective tool is context. The way that data is framed can make a very real impact on how it’s interpreted. For example, this case study from the New York Times shows two different framings of the same economic data and how, depending on where the author starts the X-Axis, it can tell 2 very different — but both accurate — stories about the subject.
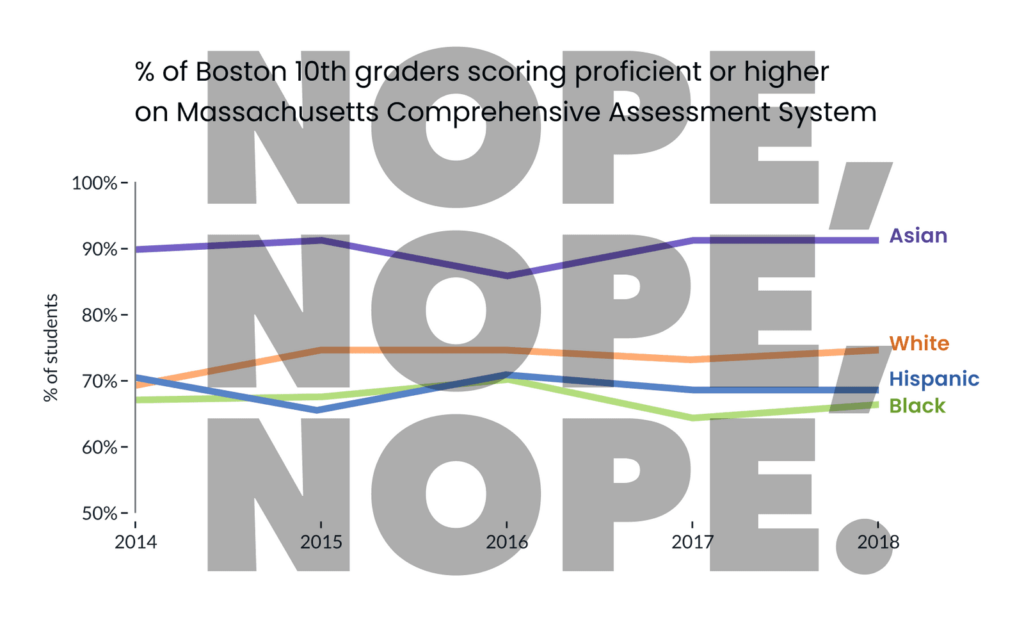
As Pieta previously highlighted, dataviz in spaces that address race / ethnicity are sensitive to “deficit framing.” That is, when it’s presented in a way that over-emphasizes differences between groups (while hiding the diversity of outcomes within groups), it promotes deficit thinking (see below) and can reinforce stereotypes about the (often minoritized) groups in focus.
In a follow up study, Eli and Cindy Xiong (of UMass’ HCI-VIS Lab) confirmed Pieta’s arguments, showing that even “neutral” data visualizations of outcome disparities can lead to deficit thinking (and therefore stereotyping) and that the way visualizations are designed can significantly impact these harmful tendencies.