Unfortunately, fraud is rampant in the insurance industry. Property and casualty insurance alone loses about $30 billion to fraud every year, and fraud occurs in nearly 10% of all P&C losses. ML can mitigate this issue by identifying potential claim situations early in the process. Flagging early allows insurers to investigate and correctly identify a fraudulent claim.
5. Claims processing
Claims processing is notoriously arduous and time-consuming. ML technology is a tool to reduce processing costs and time, from the initial claim submission to reviewing coverages. Moreover, ML supports a great customer experience because it allows the insured to check the status of their claim without having to reach out to their broker/adjuster.
The big takeaway from the GFOA’s Rethinking Revenue project is that the modern economy is shifting the tax burden toward those who can least afford it. Now, the association and its partners are launching pilot programs to test some of the ideas the project has explored.
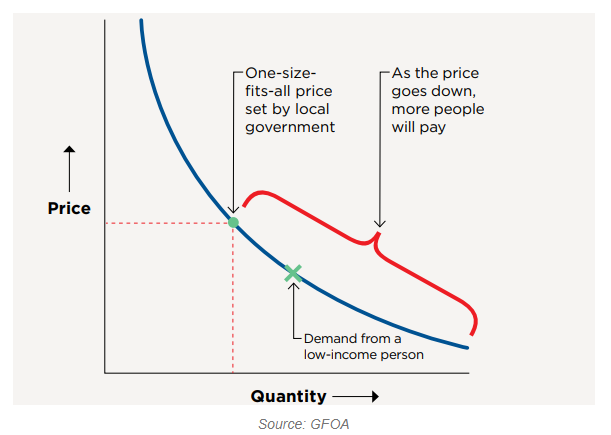
One will target the inequities built into relying on fees and fines and the GFOA is inviting governments to apply for a pilot project testing segmented pricing as a potential solution. Instead of a one-size-fits-all fine, segmented pricing is designed around a user’s ability or willingness to pay. For example, a $100 speeding ticket for someone who earns just $500 a week is a much larger financial burden than it is for someone who earns $2,000 a week. So for the lower-income transgressor, the fine is lowered to $50. It still stings, but it’s much more likely to get paid.
Shane Kavanagh, GFOA’s senior manager of research, said they’re looking for around five places to test this idea and that the tested revenue source would have to be large enough (such as traffic fines) and also be one that the government has had difficulty collecting.
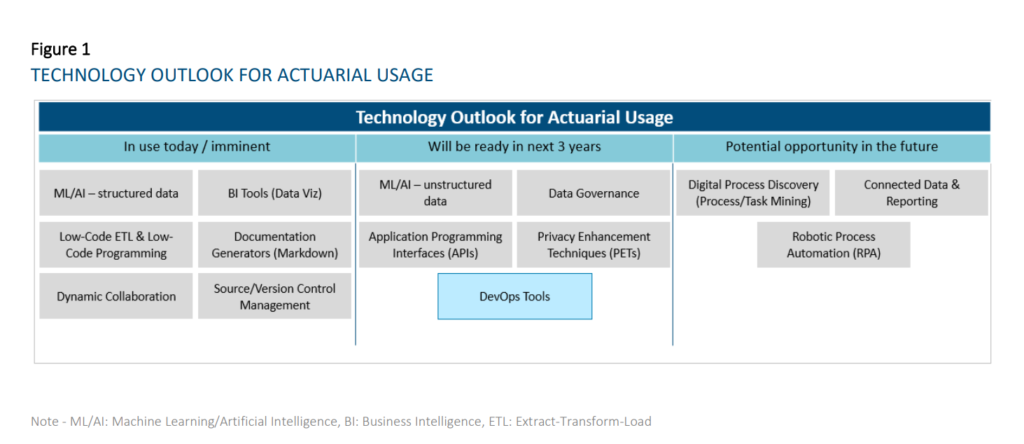
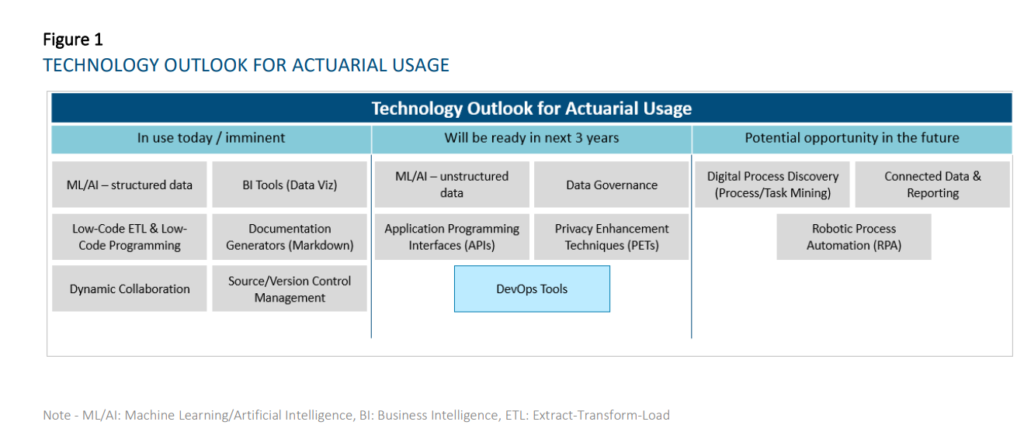
This research evaluates the current state and future outlook of emerging technologies on the actuarial profession over a three-year horizon. For the purpose of this report, a technology is considered to be a practical application of knowledge (as opposed to a specific vendor) and is considered emerging when the use of the particular technology is not already widespread across the actuarial profession. This report looks to evaluate prospective tools that actuaries can use across all aspects and domains of work spanning Life and Annuities, Health, P&C, and Pensions in relation to insurance risk. We researched and grouped similar technologies together for ease of reading and understanding. As a result, we identified the six following technology groups:
Machine Learning and Artificial Intelligence
Business Intelligence Tools and Report Generators
Extract-Transform-Load (ETL) / Data Integration and Low-Code Automation Platforms
Collaboration and Connected Data
Data Governance and Sharing
Digital Process Discovery (Process Mining / Task Mining)
Author(s):
Nicole Cervi, Deloitte Arthur da Silva, FSA, ACIA, Deloitte Paul Downes, FIA, FCIA, Deloitte Marwah Khalid, Deloitte Chenyi Liu, Deloitte Prakash Rajgopal, Deloitte Jean-Yves Rioux, FSA, CERA, FCIA, Deloitte Thomas Smith, Deloitte Yvonne Zhang, FSA, FCIA, Deloitte
Publication Date: October 2021
Publication Site: Society of Actuaries, SOA Research Institute
Technologies that have reached widespread adoption today: o Dynamic Collaboration Tools – e.g., Microsoft Teams, Slack, Miro – Most companies are now using this type of technology. Some are using the different functionalities (e.g., digital whiteboarding, project management tools, etc.) more fully than others at this time. • Technologies that are reaching early majority adoption today: o Business Intelligence Tools (Data Visualization component) – e.g., Tableau, Power BI — Most respondents have started their journey in using these tools, with many having implemented solutions. While a few respondents are lagging in its adoption, some companies have scaled applications of this technology to all actuaries. BI tools will change and accelerate the way actuaries diagnose results, understand results, and communicate insights to stakeholders. o ML/AI on structured data – e.g., R, Python – Most respondents have started their journey in using these techniques, but the level of maturity varies widely. The average maturity is beyond the piloting phase amongst our respondents. These are used for a wide range of applications in actuarial functions, including pricing business, modeling demand, performing experience studies, predicting lapses to support sales and marketing, producing individual claims reserves in P&C, supporting accelerated underwriting and portfolio scoring on inforce blocks. o Documentation Generators (Markdown) – e.g., R Markdown, Sphinx – Many respondents have started using these tools, but maturity level varies widely. The average maturity for those who have started amongst our respondents is beyond the piloting phase. As the use of R/Python becomes more prolific amongst actuaries, the ability to simultaneously generate documentation and reports for developed applications and processes will increase in importance. o Low-Code ETL and Low-Code Programming — e.g., Alteryx, Azure Data Factory – Amongst respondents who provided responses, most have started their journey in using these tools, but the level of maturity varies widely. The average maturity is beyond the piloting phase with our respondents. Low-code ETL tools will be useful where traditional ETL tools requiring IT support are not sufficient for business needs (e.g., too difficult to learn quickly for users or reviewers, ad-hoc processes) or where IT is not able to provision views of data quickly enough. o Source Control Management – e.g., Git, SVN – A sizeable proportion of the respondents are currently using these technologies. Amongst these respondents, solutions have already been implemented. These technologies will become more important in the context of maintaining code quality for programming-based models and tools such as those developed in R/Python. The value of the technology will be further enhanced with the adoption of DevOps practices and tools, which blur the lines between Development and Operations teams to accelerate the deployment of applications/programs
Author(s):
Nicole Cervi, Deloitte Arthur da Silva, FSA, ACIA, Deloitte Paul Downes, FIA, FCIA, Deloitte Marwah Khalid, Deloitte Chenyi Liu, Deloitte Prakash Rajgopal, Deloitte Jean-Yves Rioux, FSA, CERA, FCIA, Deloitte Thomas Smith, Deloitte Yvonne Zhang, FSA, FCIA, Deloitte
In the midst of the uncertainty, Epic, a private electronic health record giant and a key purveyor of American health data, accelerated the deployment of a clinical prediction tool called the Deterioration Index. Built with a type of artificial intelligence called machine learning and in use at some hospitals prior to the pandemic, the index is designed to help physicians decide when to move a patient into or out of intensive care, and is influenced by factors like breathing rate and blood potassium level. Epic had been tinkering with the index for years but expanded its use during the pandemic. At hundreds of hospitals, including those in which we both work, a Deterioration Index score is prominently displayed on the chart of every patient admitted to the hospital.
The Deterioration Index is poised to upend a key cultural practice in medicine: triage. Loosely speaking, triage is an act of determining how sick a patient is at any given moment to prioritize treatment and limited resources. In the past, physicians have performed this task by rapidly interpreting a patient’s vital signs, physical exam findings, test results, and other data points, using heuristics learned through years of on-the-job medical training.
Ostensibly, the core assumption of the Deterioration Index is that traditional triage can be augmented, or perhaps replaced entirely, by machine learning and big data. Indeed, a study of 392 Covid-19 patients admitted to Michigan Medicine that the index was moderately successful at discriminating between low-risk patients and those who were at high-risk of being transferred to an ICU, getting placed on a ventilator, or dying while admitted to the hospital. But last year’s hurried rollout of the Deterioration Index also sets a worrisome precedent, and it illustrates the potential for such decision-support tools to propagate biases in medicine and change the ways in which doctors think about their patients.
The Illinois program gives people recovering from covid-19 a take-home kit that includes a pulse oximeter, a disposable Bluetooth-enabled sensor patch, and a paired smartphone. The software takes data from the wearable patch and uses machine learning to develop a profile of each person’s vital signs. The monitoring system alerts clinicians remotely when a patient’s vitals— such as heart rate—shift away from their usual levels.
Typically, patients recovering from covid might get sent home with a pulse oximeter. PhysIQ’s developers say their system is much more sensitive because it uses AI to understand each patient’s body, and its creators claim it is much more likely to anticipate important changes.
“It’s an enormous benefit,” says Terry Vanden Hoek, the chief medical officer and head of emergency medicine at University of Illinois Health, which is hosting the pilot. Working with covid cases is hard, he says: “When you work in the emergency department it’s sad to see patients who waited too long to come in for help. They would require intensive care on a ventilator. You couldn’t help but ask, ‘If we could have warned them four days before, could we have prevented all this?’”
Since that experiment, have you seen this phenomenon replicated in the real world?
Every time I see a Tesla accident. Especially the earlier ones. I was like, “Yep, there it is.” People are trusting these systems too much. And I remember after the very first one, what did they do? They were like, now you’re required to hold the steering wheel for something like five-second increments. If you don’t have your hand on the wheel, the system will deactivate.
But, you know, they never came and talked to me or my group, because that’s not going to work. And why that doesn’t work is because it’s very easy to game the system. If you’re looking at your cell phone and then you hear the beep, you just put your hand up, right? It’s subconscious. You’re still not paying attention. And it’s because you think the system’s okay and that you can still do whatever it was you were doing—reading a book, watching TV, or looking at your phone. So it doesn’t work because they did not increase the level of risk or uncertainty, or disbelief, or mistrust. They didn’t increase that enough for someone to re-engage.
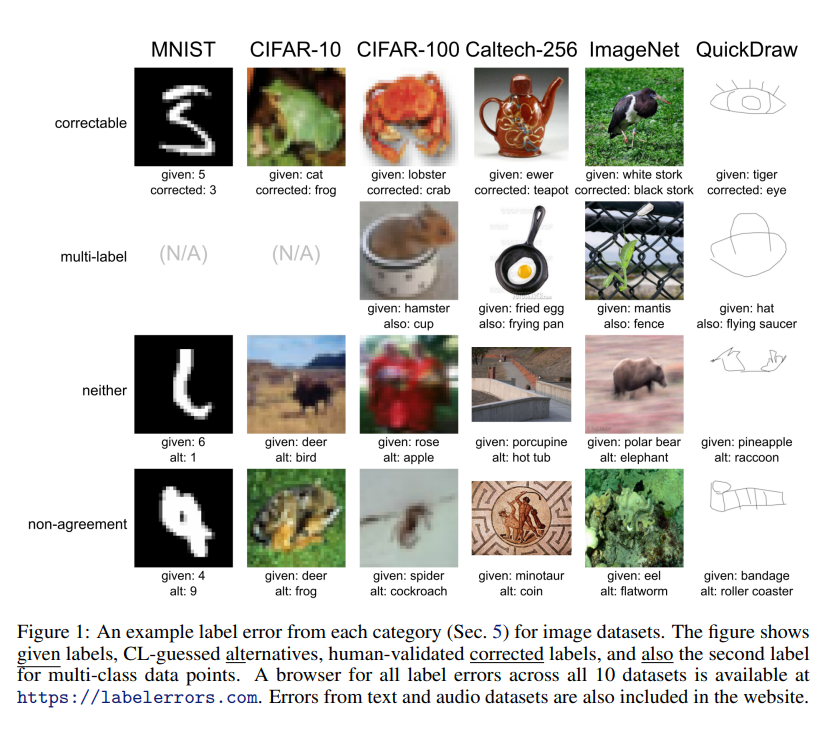
Yes, but: In recent years, studies have found that these data sets can contain serious flaws. ImageNet, for example, contains racist and sexist labels as well as photos of people’s faces obtained without consent. The latest study now looks at another problem: many of the labels are just flat-out wrong. A mushroom is labeled a spoon, a frog is labeled a cat, and a high note from Ariana Grande is labeled a whistle. The ImageNet test set has an estimated label error rate of 5.8%. Meanwhile, the test set for QuickDraw, a compilation of hand drawings, has an estimated error rate of 10.1%.
The video features Neil Raden who is the author of ethical use of AI for Actuaries. Alongside him , it features Kevin Pledge who is CEO of Acceptiv , FSA,FIA and chair of Innovation and Research Committee of SOA. We discuss about the issue of ethics and about the use of new data sources in the recent Emerging issues in Underwriting Survey Report by IfOA.
The NAIC 2021 priorities and the charges to its key committees are (in no specific order):
COVID-19— In 2021, the NAIC will continue its “Priority One” initiative designed to support state insurance departments in their response to the ongoing pandemic and its impact on consumers and insurance markets. NAIC has a COVID resource page that includes information on actions taken by individual states in response to the COVID 19 pandemic that impact various lines of insurance. NAIC said insurance regulators will continue to analyze data and develop the tools so that consumer protection keeps pace with changes brought on by the virus.
Big Data/Artificial Intelligence — The Big Data and Artificial Intelligence Working Group is chaired by Doug Ommen, Iowa, joined by Elizabeth Kelleher Dwyer, co-vice chair, Rhode Island and Mark Afable, co-vice chair, Wisconsin.
…..
Race & Insurance — The Special Committee on Race and Insurance is co-chaired by Maine Superintendent Eric Cioppa and New York Executive Deputy Superintendent of Insurance My Chi To.
The 2021 agenda for this panel calls for research into the level of diversity and inclusion within the insurance sector; engagement with a broad group of stakeholders on issues related to race, diversity and inclusion in, and access to, the insurance sector and insurance products; and an examination of current practices or barriers in the insurance sector that potentially disadvantage people of color and historically underrepresented groups.